Original Article
, Volume: 12( 1)The Effect of ZnO and its Nanocomposite on the Performance of Dye-Sensitized Solar Cell
- *Correspondence:
- Selim H, Egyptian Petroleum Research Institute, 11727, Cairo, Egypt, Tel: +841673326268; E-mail: hanaaselimali@yahoo.com
Received: Dec 14, 2017; Accepted: Jan 23, 2018; Published: Jan 31, 2018
Citation: Selim H, Nada AA, Eid M, et al. The Effect of ZnO and it’s Nanocomposite on the Performance of Dye-Sensitized Solar Cell. Nano Sci Nano Technol. 2018;12(1):122
Abstract
The effect of CuO doping of ZnO nanoparticles on the performance of dye sensitize solar cells (DSSCs) has been investigated. Initially ZnO nanoparticles was synthesized using co-preciptation method then ZnO-CuO nanocomposite were fabricated by a novel Pechini route using different CuO molar concentration ratios applied in dye-sensitized solar cells (DSSCs). The thermal, structural, optical and electrical characterization were done using various techniques such as (TGA/ DSC) , XRD, HR-TEM, FT-IR, Raman, UV-DRS, PL, I-V. The results of the XRD analysis showed that the CuO-ZnO composite has a nanometer size and the existence of new peak at 38.65O corresponds to secondary phase of CuO, which informs the doping process. UV-DRS spectra of doped samples showed red shift of reflectance band compared to pure ZnO NPs and PL spectra showed a strong emission band at 400 nm. At the optimized condition, the thin films of undoped ZnO and CuO doped ZnO were pasted on ITO glass using Pulse Laser Deposition (PLD) technique and used as working electrodes in dye sensitized solar cells (DSSCs). These working electrodes were sensitized with Eosin dye and coupled with platinum coated cathode. I-V measurements showed improved performance of ZnO-CuO nanocomposite DSSC with the efficiency of 2.9± 0.22 % at the optimum doping (ZC1.5) were observed as compared to ZnO DSSC 1.26 ± 0.08%.
Keywords
ZnO nanoparticles; ZnO-CuO nanocomposite; Dye-sensitized solar cell (DSSC); Efficiency
Introduction
Dye-sensitized solar cells (DSSCs), the third-generation photovoltaic technology, that holds significant promise for the inexpensive conversion of solar energy to electrical energy compared to conventional silicon solar cells because of favorable environmental, low cost, nontoxic, good temperature stability, stable electrical generation and easy production solar cells [1], their key components, including the photoanode, sensitizer, electrolyte and counter electrode. Nano size semiconductor compound is used as photoanodes because of their functions in absorbing dye molecules and transferring electrons [2]. It must have a high electron transport rate to decrease electron-hole recombination rate and increase conversion efficiency [3-5]. Zinc oxide is one of the semiconductor compounds with different nanostructure morphologies and high electron mobility [6-16]. ZnO has been considered as a promising candidate for DSSCs due to its carrier mobility and direct band gap. ZnO is a wide band gap semiconductor with 3.30 eV at room temperature. Low dimensional ZnO nanostructures have been extensively investigated due to its unique structural, electrical and optical properties [17,18]. It is promising material for many optoelectronic applications such nanoscale lasers piezo-electric devices, chemical sensors and solar cells [19,20]. On other hand, copper oxide is one of the candidate materials. The features of copper oxide semiconductors are relatively higher optical absorption, low cost of raw materials and non-toxic. CuO is p-type transition metal oxide with a narrow band gap (Eg ~ 1.2 eV), which close to the ideal energy gap of 1.4 eV for solar cells and allows for good solar spectral absorption. The low band gap of CuO makes it possible to absorb throughout the visible spectrum. In order to obtain better crystallization quality, better optical and electrical properties, researches have preferred doping in metal oxides. Zinc is an important transition metal element and Zn2+ has close ionic radius parameter to that of Cu2+, which means that Zn can easily penetrate into CuO crystal lattice or substitute Cu position in the crystal [21,22]. In this work, ZnO-CuO nanocomposite is used for increasing the photovoltaic performance of Dye sensitized solar cell. Initially these materials were synthesized and then characterized using TGA/DSC, XRD, HR-TEM, FT-IR, Raman, UV-DRS, PL and I-V measurements.
In this work, it is observed that the nanohole arrays could also be formed in nanoripples fabricated with the irradiation of an 800-nm femtosecond laser in an alcohol environment. The diameter of the holes ranges from 10 nm-30 nm. Note that the nanoholes are much smaller than the wavelength of the incident laser, which is 800 nm. The structure is different with the classical laser-induced nanostructures in two aspects. For one thing, the size is in order of tens nano-meter instead of hundreds of nano-meters. For the other thing, the structures can only be formed under irradiation under irradiation in liquids environment. Specifically, under irradiation in alcohol, more nanohole arrays are formed and the holes are more uniform, as compared to those generated under irradiation in water. This method can be used for manufacturing deep-subwavelength nanostructures using laser irradiation. The nanohole arrays are characterized using a scanning electron microscope (SEM). In addition, we investigate the influence of the laser scanning speed to the deep-subwavelength nanohole arrays.
Experimental
Materials
The chemicals used are of analytic grade and used without further purification, zinc nitrate (Zn(NO3)2.6H2O) {228737, 98%}, copper nitrate (Cu(NO3)2. 6H2O) {72252, >98.5%}, Citric acid monohydrate (C6H8O7.H2O) {1909, >99%} and ethylene glycol (HOCH2CH2OH) {1.00949, >99%}, lithium iodide (LiI) {223816, 98%}, Eosin-Y {230251} and hydrogen hexachloroplatinate (IV) hydrate {81080, 38%} were obtained from Sigma-Aldrich Company as a powder material of high purity of 98.85%, or better. Iodine (I2) {13380, 99.8%}, ethanol {02875, 99.8%} and acetone {179973, 99.5%} were obtained from Honeywell Company.
Synthesis
The fabrication process involves co-precipitation method [23] of ZnO nanoparticles, 7.44 mg of zinc nitrate Zn(NO3)2 was dissolved in 500 ml deionized water and stirred for 30 min at 100°C. The pH was adjusted at 6 by using 1M NaOH and stirring it for one hour. The mixture was centrifuged at a speed of 4000 rpm and the precipitates were collected. The white powder obtained was washed several times with deionized water and ethanol. It was then dried at 80°C in an electric oven and calcinated at 450°C for 4 h in the air to remove any organic residues.
The synthesis of CuO-ZnO NCs by Pechini method with different molar ratios (0.5, 1.0, 1.5, 2.0 and 2.5%) of CuO precursor and donated as (ZC0.5, ZC1.0, ZC1.5, ZC 2.0 and ZC 2.5). The appropriated amounts of citric acid monohydrate (C6H8O7.H2O) and ethylene glycol (HOCH2CH2OH) are dissolved completely in deionized water to form a sol at 60°C for 1 h in oil bath and further heated at 80°C for 1 h to remove excess water. The reagents (Zn (NO3)2. 6H2O and Ni (NO3)2. 6H2O were added to the solution and heated at 110°C for 1 h in order to start esterification. The blue solution became more and more viscous and finally a xerogel was obtained. The xerogel was dried at 80°C for 24 h in an electric oven and then it was pyrolysised at 450°C for 4 h in nitrogen. Make TGA/DSC to identify the optimum temperatures for calcination. The obtained powders were calcinated at different temperatures (400°C, 600°C and 800°C) for 4 h according to TGA/DSC results. Later, they were ball milled for 30 min to break down the agglomerates.
DSSC Fabrication
The synthesized samples were deposited on quartz substrate coated with indium tin oxide (ITO) with thickness of 100-150 nm using Pulse Laser Deposition (PLD) at wave length of 1064 nm (Q-switched Nd:YAG laser). The prepared thin films were considered photo-electrodes of DSSCs. The prepared photo-electrodes were immersed in 0.04 g of Eosin-Y organic dye (C20H8Br4Na2O5) dissolved in 100 ml acetone for 24 h. The platinum-coated counter electrode was prepared by (4 mM hydrogen hexachloro-platinate (IV) hydrate, H2PtCl6.aq in ethanol solution) depositing on ITO-glass and calcinated at 400°C in the air for 1 h. The redox electrolyte consisting of 0.3 M LiI and 0.03 M I2 in polyethylene carbonate was injected into the inter-electrode space from the counter-electrode side through a predrilled hole.
Experimental techniques
The Differential thermal analysis was carried out using Q600 DST simultaneous DSC/TGA apparatus at a heating rate of 10°C/min in temperature ranging from room temperature to 1000°C under air flow. The phase of the prepared samples was examined by X-ray diffraction (XRD) using a diffractometer (Panalytical XPERT PRO MPD). CuKα radiation (λ=1.5418 Å)
was used at a rate of 40 kV and 40 mA. The morphology was investigated by High Resolution Transmission Electron Microscope (HR-TEM) – model JEM-2100, JEOL, Japan. The structural study of the prepared samples was investigated by Raman spectroscopy with laser source 532 nm and power 10 mW (model Sentera, Bruker, Germany). The functional groups were identified using a Fourier transform infrared spectrometer (FT-IR) model spectrum one (Perkin Elmer, USA) in the wave number range of 400 cm-1-4000 cm-1. The optical reflectance was recorded using a UV-vis spectrometer (Perkin Elmer Lambda 1050). The photoluminescence spectra were recorded using a Perkin Elmer LS 50B luminescence spectrophotometer. The current-voltage (I-V) measurements of the fabricated DSSC were measured by using a solar simulator (Solar-Light (Science tech SS150W-AAA) and an electrometer (2400 Keithley Source Meter SSIVT-60WC), while Air Mass1.5-filtered light from the 150 W-Xenon lamp of the solar simulator the DSSC at a power density of Pi=100 mW/cm2 and to calculate error, measurement was repeated three times.
Results and Discussion
Thermal analysis
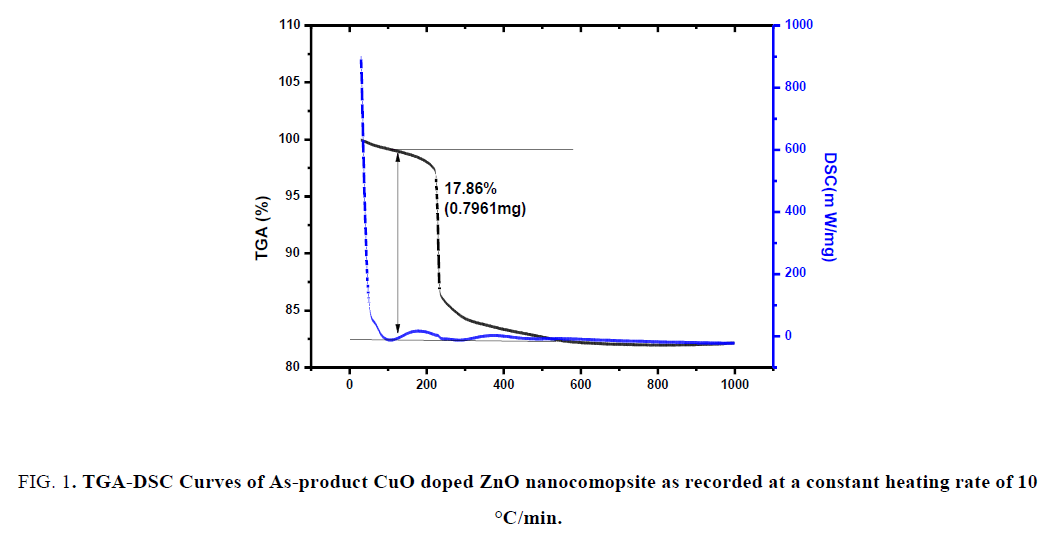
For the thermal gravimetric analysis and differential scanning calorimeter (TGA/DSC), the prepared samples were heated at a constant rate of 10°C/min under air atmosphere in the temperature range up to 1000°C. From the TGA curve of CuO-ZnO NCs, the total weight loss approximately is 17.86% (0.7961 mg) of the total weight of the investigated sample at 127.78°C as shown in FIG. 1.
FIG. 1. TGA-DSC Curves of As-product CuO doped ZnO nanocomopsite as recorded at a constant heating rate of 10 °C/min.
Structural morphological characterization
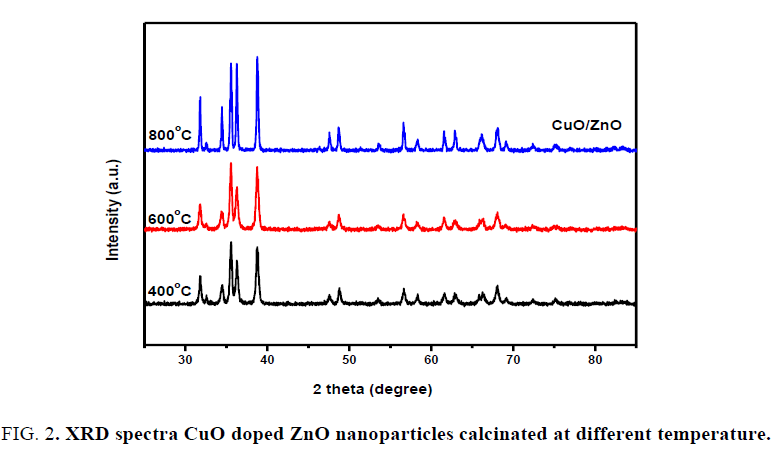
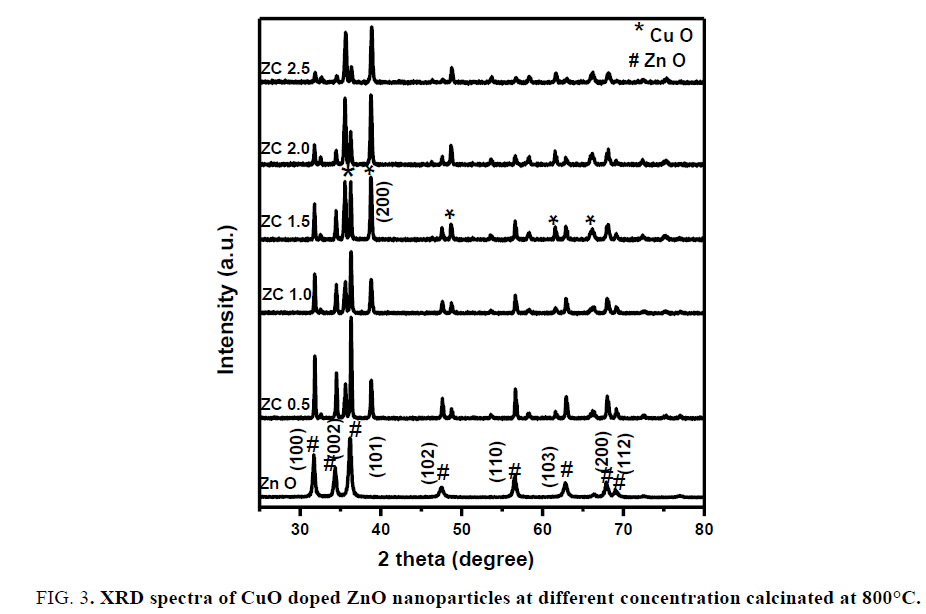
X-Ray diffraction analysis (XRD): FIG. 2 shows the XRD patterns of CuO-ZnO nanocomposite at expected molar ratio ZC1.5 calcinated at different temperatures (400°C, 600°C and 800°C) according to the results obtained from TGA/DSC. It is observed that the existence of strong and sharp peaks appeared at 800°C and confirm the optimum doped CuO-ZnO NCs which agree with standard powder diffraction patterns (JCPDS card No.04-008-2755), but at lower temperature, the doping of ZnO was not successfully occurred. FIG. 3 shows XRD diffraction patterns of all the prepared samples (ZnO, ZC 0.5, ZC1.0, ZC1.5, ZC 2.0 and ZC 2.5) calcinated at 800°C and reveals that the diffraction peaks appear at angles (2?) of 31.36, 34.03, 35.86, 47.16, 56.26, 62.54, 67.64 and 68.79 corresponding to the respective crystal planes of (100), (002), (101), (102), (110), (103), (200) and (112) of the poly crystalline hexagonal wurtzite of zinc oxide NPs structure that matches with (JCPDS card No. 01-080-4199). New peak appears at 38.65O corresponds to secondary phase of CuO matched with (JCPDS card No. 00-048-1548) and the optimum doped CuO-ZnO NCs occurred with ZC1.5. At lower molar ratio (<1.5) of CuO precursor, the two metal oxides are not successfully doped. At further molar ratio (>1.5) the peaks of ZnO disappeared.
The crystalline size of the samples was calculated from the full width at half maximum (FWHM) of the XRD pattern FIG. 3, using Williamson-Hull’s formula [24]:
β × cos (θ)=[K × λ/D]+[4 × S × sin (θ)] (1)
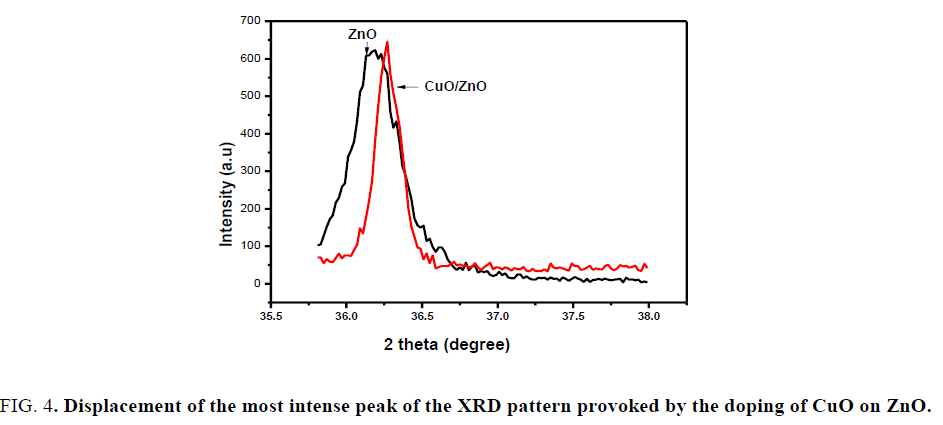
Where β is FWHM in radians, λ is wavelength of X-rays used, θ is scattering Bragg angle, D is particle diameter and S is the strain. The parameter K is the shape factor (taken as 0.94). The calculated particle sizes for the prepared samples are listed in TABLE 1 and the results indicated that particle sizes increase with the increasing amount of CuO. FIG. 4 shows the most intense XRD peaks of undoped and CuO doped ZnO NCs at molar ratio of 1.5% calcinated at 800°C. As shown, the peak of CuO doped ZnO reveals a slight shift towards higher angles compared to ZnO NPs reported, because of the fact that ionic radius of Cu2+ (rCu2+=0.73 Å) is very close to that of (rZn2+=0.74 Å), due to which Cu can easily penetrate into ZnO crystal lattice.
FIG. 4. Displacement of the most intense peak of the XRD pattern provoked by the doping of CuO on ZnO.
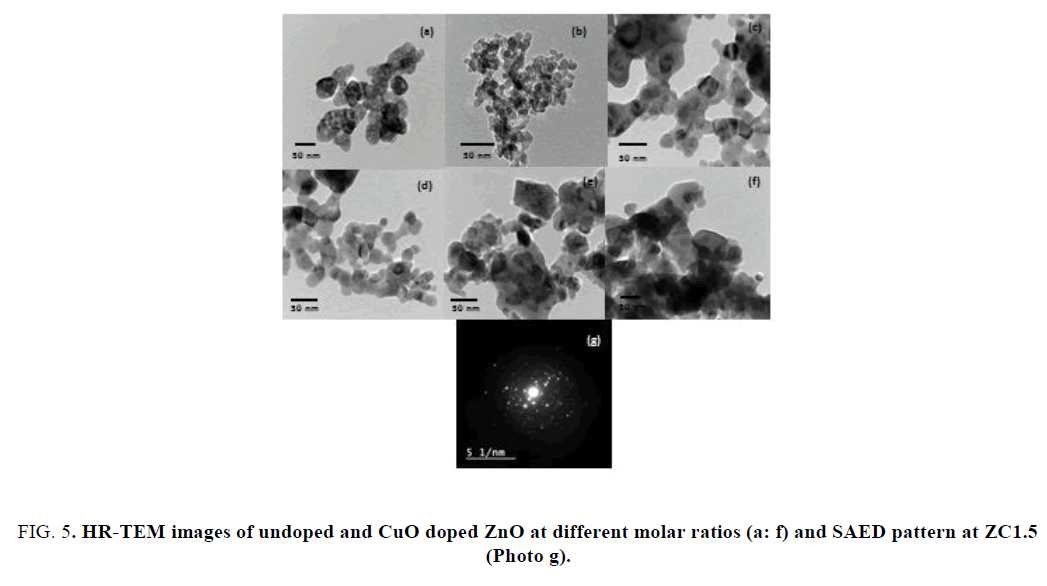
Transmission electron microscope (TEM): FIG. 5(a-f) show the HR-TEM images of ZnO NPs and the nanocomposite CuO-ZnO with different molar ratios from 0.5% to 2.5% respectively, with perfect morphology and crystal quality compared to undpoed ZnO NPs, which shows an hexagonally shaped nanoparticles and larger rectangular platelets. The optimum regular spherical and uniform particle size distribution was obtained at ZC1.5 and this result was compatible with the XRD patterns FIG. 3. The crystallinity and preferential orientation of the NPs in the sample are further confirmed by the selected area electron diffraction (SAED) pattern, as shown in FIG. 5(g) and the SAED pattern for the optimum sample ZC1.5, which shows the diffraction rings of polycrystalline nature for doped sample.
FIG. 5. HR-TEM images of undoped and CuO doped ZnO at different molar ratios (a: f) and SAED pattern at ZC1.5 (Photo g).
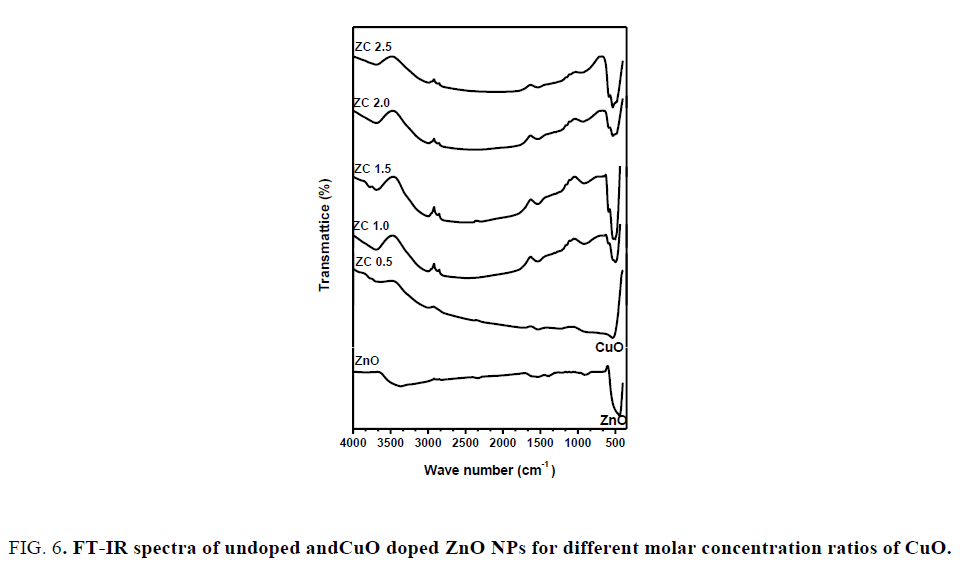
Fourier transform-Infrared (FT-IR) spectra: FIG. 6 shows FT-IR spectra recorded in the range of 400 cm-1-4000 cm-1 for the ZnO NPs and CuO-ZnO nanocomposite at different molar ratio. The broad absorption peak near 3367 cm-1correspond to O-H stretching. The peaks at 1560 cm-1 and 1395 cm-1 attributed to the symmetric and asymmetric C=O stretching vibration modes, whereas small peak at 913 cm-1 is attributed to C-H stretching. The peak at 430 cm-1 shows the stretching band of ZnO. The spectra of CuO-ZnO NCs show a new vibration mode at 670 cm-1 corresponding to Cu-O stretching bond, which indicated that CuO was successfully doped with ZnO NPs. Hence, it is a nice supporting result for the previous investigations.
FIG. 6. FT-IR spectra of undoped andCuO doped ZnO NPs for different molar concentration ratios of CuO.
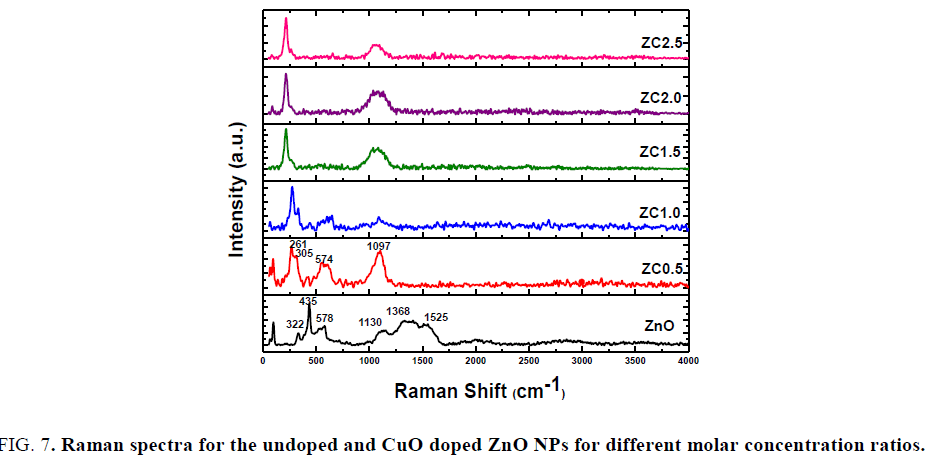
Raman spectroscopy: Raman spectroscopy shows the vibrational modes of the prepared samples for detecting the incorporation of dopant. As shown in FIG. 7, the spectrum of pure ZnO exhibits significant peak of E2(High) mode at 435 cm-1 representing wurtzite hexagonal structure of ZnO associated with the motion of oxygen atoms in ZnO lattice [25] and other peaks observed at 322 cm-1, 578 cm-1, 1130 cm-1, 1368 cm-1 and 1525 cm-1. The two peaks at 322 cm-1 and 578 cm-1 are assigned to be (E2H-E2L) and A1 (LO), respectively. The Raman shift of CuO – ZnO NCs as compared to undoped ZnO, blue shift of the Raman peaks is observed at 322 cm-1, 435 cm-1 and 1130 cm-1 and red shift is observed at 578 cm-1. While the intensity of peak 322 and 578 cm-1 increased, peak 435 cm-1 decreased, peaks at 1368 cm-1and 1525 cm-1 vanished and observed peaks at 236 cm-1 and 1117 cm-1 increased and shifted to lower with increasing doping. According to literature, the additional modes are induced by host lattice defects; the host lattice defects in ZnO are activated and implied with doping content and then these modes appears [26]. The changes in the intensity of peaks confirm the successfully doped ZnO.
FIG. 7. Raman spectra for the undoped and CuO doped ZnO NPs for different molar concentration ratios.
Optical characteristics
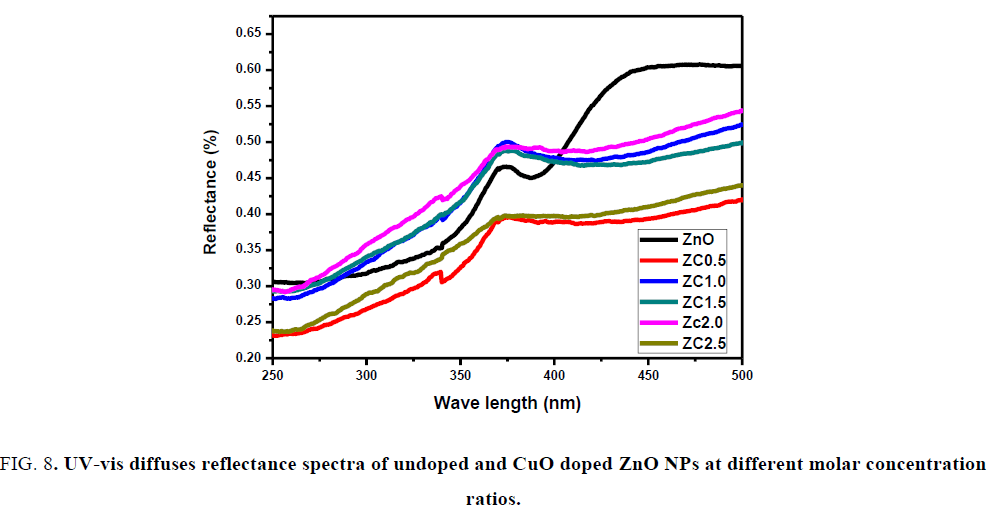
UV-vis spectrum analysis: The Diffuse reflectance spectra of the prepared samples were investigated using UV-vis optical spectroscopy in the range of 200 nm-800 nm. As shown in FIG. 8, the optical band gaps of the prepared samples have been estimated from the plots of reflection percentage versus energy (h?) and tabulated in TABLE 1 using the equation (αh?)2=A (h?-Eg), where α is the absorption coefficient, h? the photon energy, A the constant relative to the material, Eg the absorption band gap [27]. There is an obvious red shift in doped samples compared with ZnO, the band gap decreases with the increasing amount. The reflectance spectrum of undoped ZnO was observed at 370 nm and gets shifted towards longer wavelength region for doped ZnO. The red shift in the band edge with the increasing copper oxide dopant is a clear indication of the doping of CuO with ZnO [28]. The results display extended photo response range in visible light and the efficient separation of electron-hole pairs might be achieved.
FIG. 8. UV-vis diffuses reflectance spectra of undoped and CuO doped ZnO NPs at different molar concentration ratios.
| CuO Conc.% | Eg (eV) | D (nm) |
|---|---|---|
| ZnO | 3.32 | 25.71 |
| ZC0.5 | 3.85 | 30.98 |
| ZC1.0 | 2.75 | 55.53 |
| ZC1.5 | 2.64 | 85.53 |
| ZC2.0 | 2.48 | 105.80 |
| ZC 2.5 | 2.32 | 106.69 |
TABLE 1. Average crystal size and band gap of undoped and CuO doped Zno NPs.
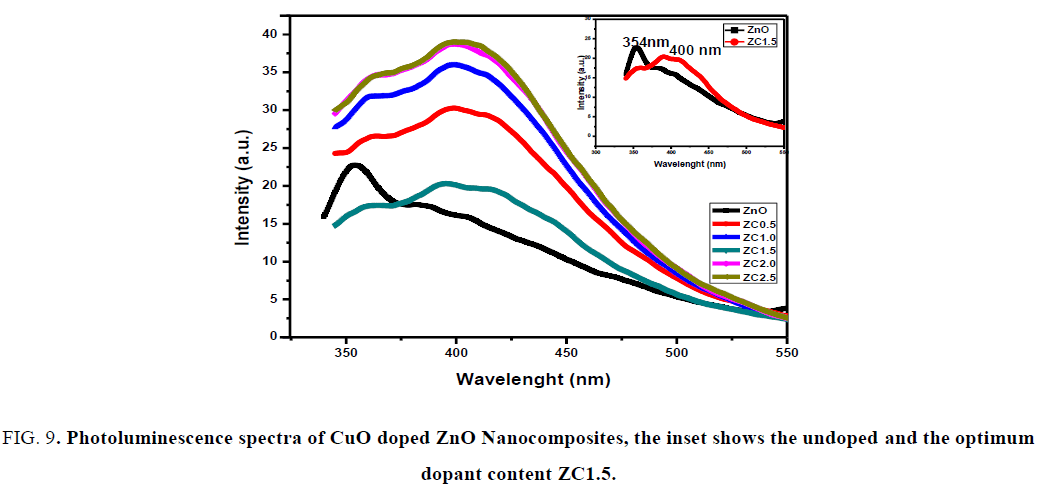
Photoluminescence (PL) spectroscopy: The room-temperature PL spectra of the investigated samples at excitation wavelength of 325 nm are shown in FIG. 9. The UV emission is attributed to the near-band-edge emission from the recombination of free excitons through an exciton-exciton collision process [29]. The PL spectrum of pure ZnO reveals strong and broad UV band peak centered at 354 nm. After CuO doping, the UV emission peaks shift to wave length at 400 nm, due to the irradiative transition from Zn interstitial to valence band, the optimum doping at molar concentration ratio 1.5 (ZC1.5) and the intensity of UV peaks decrease indicates low recombination between electrons and holes. These results show a great promise of the CuO doped ZnO NCs in optoelectronics devices.
FIG. 9. Photoluminescence spectra of CuO doped ZnO Nanocomposites, the inset shows the undoped and the optimum dopant content ZC1.5.
Current-voltage characteristics
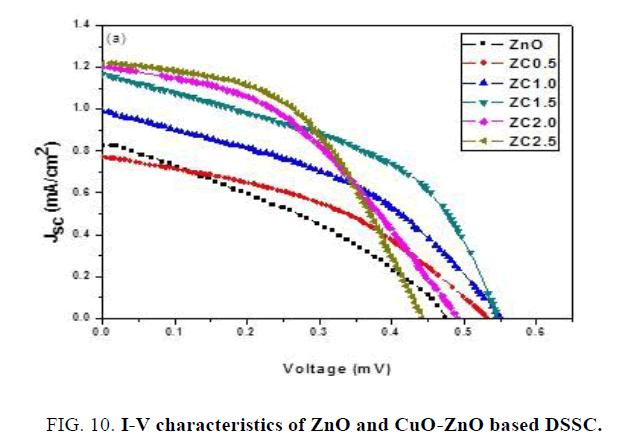
FIG. 10 shows the current-voltage (I-V) curves of DSSC based on ZnO NPs and DSSC based on CuO doped ZnO NCs and the detailed photovoltaic (PV) parameters obtained from I-V curves as a function of CuO precursor amount are summarized in TABLE 2. As can be seen the performance of ZnO DSSC compared to CuO-ZnO DSSC with improvement of the short circuit photocurrent (Jsc) from 0.82 mA/cm2 to 1.16 mA/cm2, fill factor (FF) from 32.25% to 46% and decrease the open circuit voltage (VOC) from 0.47 V to 0.54 V. we find that the photovoltaic efficiency of DSSC using ZnO has been improved significantly after the CuO doping at ZC 1.5 from 1.26% ± 0.10% to 2.96% ± 0.22% respectively. From these results, it was concluded that CuO-ZnO nano composite has better photovoltaic performance and excellent long-term stability, which can be a suitable candidate for commercial DSSC application [30].
| CuO precursor Conc. Mol.% | 0.0 | 0.5 | 1.0 | 1.5 | 2.0 | 2.5 |
| Jsc (mA.cm-2) | 0.8276 | 0.77 | 0.99 | 1.16 | 1.20 | 1.22 |
| Voc (V) | 0.47 | 0.53 | 0.55 | 0.54 | 0.49 | 0.44 |
| FF (%) | 32.25 | 40.99 | 41.35 | 46.44 | 40.82 | 44.42 |
| ? (%) | 1.26 ± 0.09 | 1.68 ± 0.12 | 2.25 ± 0.17 | 2.96 ± 0.22 | 2.40 ± 0.18 | 2.39 ± 0.18 |
TABLE 2. DSSC PV parameters at different CuO Precursor conc. mol.%.
Conclusion
CuO doped ZnO NCs were synthesized by a novel Pechini route with different precursor molar concentration ratios from 0.0 to 2.5 mol.% using citric acid monohydrate and ethylene glycol. The structural, morphologicaly, thermal, optical and electrical characterizations were investigated. The success of the doping process was confirmed by the XRD patterns which show the existence of new peak at 38.650 at (200) plane corresponding to secondary phase CuO. XRD also shows that the optimum molar concentration ratio at (1.5 mol.%) for doping material. FT-IR spectra reveal the presence of new vibration mode at 670 cm-1 corresponding to CuO stretching mode in CuO-ZnO NCs. Raman spectra showed that blue shifted to lower frequencies due to increase of the doping content. UV spectra show red shifts in the absorption band edge upon the CuO doping. PL spectra described the shift in near band edge UV emission at 400 nm stability between h+/e- in CuO-ZnO NCs. The efficiency of DSSC using ZnO only is 1.26% ± 0.10%; whereas for CuO-ZnO NCs, the efficiency increases to 2.96% ± 0.22% at the optimum doping (ZC1.5), which can be a suitable candidate, for photovoltaic applications.
References
- Miao X, Pan K, Pan Q, et al. Highly crystalline graphene/carbon black composite counter electrodes with controllable content: Synthesis, characterization and application in dye-sensitized solar cells. Electrochimica Acta. 2013;2(4):219-225.
- Ahn SH, Chi WS, Kim DJ, et al. Honeycomb?like organized TiO2 photoanodes with dual pores for solid?state Dye?sensitized solar cells J. Ad Func Mater. 2013;23(31):3901-8.
- Mazumdar S, Bhattacharyya AJ. Dependence of electron recombination time and light to electricity conversion efficiency on shape of the nanocrystal light sensitizer. Energy Environ Sci.2013;5.
- Chen L, Zhou Y, Tu W, et al. Enhanced photovoltaic performance of a dye-sensitized solar cell using graphene- TiO2 photoanode prepared by a novel in situ simultaneous reduction-hydrolysis technique. J Nanoscale. 2013;21(5):3481-5.
- Kamat VP. Boosting the efficiency of quantum dot sensitized solar cells through modulation of interfacial charge transfer. J Acc Chem Res. 2012;45(11):1906-15.
- Yan TL, Wu LF, Peng LJ, et al. Photoanode of dye-sensitized solar cells based on a ZnO/TiO2 composite film. Int J Photoenergy. 2012:613969.
- Habibi MH, Askari E. Thermal and structural studies of zinc zirconate nanoscale composite derived from sol-gel process. J Therm Anal Calorim. 2013;111:227-33.
- Martinson ABF, Elam JW, Hupp JT, et al. ZnO Nanotube based dye-sensitized solar cells. J Nano Lett. 2007;7(8):2183-7.
- Habibi MH, Askari E. The effect of operational parameters on the photocatalytic degradation of C.I. reactive yellow 86 textile dye using manganese zinc oxide nanocomposite thin films. J Adv Oxid Technol. 2011;14:190.
- Ghaedi M, Montazerozohori M, Sahraei R. Comparison of the influence of nanomaterials on response properties of copper selective electrodes. J Ind Eng Chem. 2013;19:1356.
- Habibi MH, Sheibani R. Nanostructure silver-doped zinc oxide films coating on glass prepared by sol-gel and photochemical deposition process: Application for removal of mercaptan. J Ind Eng Chem. 2013;19:161-117.
- Habibi MH, Askari E. Permeability, solubility, diffusivity and PALS data of cross-linkable 6FDA-based copolyimides. J Ind Eng Chem. 2014;53(6):2449-60.
- Chen W, Zhang H, Hsing IM, et al. A new photoanode architecture of dye sensitized solar cell based on ZnO nanotetrapods with no need for calcination. J Electro chem Commum. 2009;11(5):1057-60.
- Habibi MH, Askari E. Synthesis, structural characterization, thermal and electrochemical investigations of a square pyramid manganese (III) complex with a schiff base ligand acting as N2O2 tetradentate in equatorial and as O monodendate in axial positions: Application as a precursor for preparation of Mn-Doped ZnO nanoparticle. J Org Chem. 2013;43(4):406-11.
- Zhang Q, Dandeneau CS, Zhou X, et al. ZnO Nanostructures for dye-sensitized solar cells. J Adv Mater. 2009;21(41) 4087-108.
- Habibi MH, Habibi AH. Sol-gel combustion synthesis and characterization of nanostructure copper chromite spinel. J Therm Anal Calorim. 2013;115(2):1329-33.
- Senthil TS, Muthukumarasamy N, Misook K. ZnO Nanorods based dye sensitized solar cells sensitized using natural dyes extracted from beetroot, rose and strawberry. J Bull Korean Chem Soc. 2014;35(4):1056.
- Al-Kahlout A. Thermal treatment optimization of ZnO nanoparticles-photoelectrodes for high photovoltaic performance of dye-sensitized solar cells. J Assoc Arab Univ Basic Appl Sci. 2015;17:66-72.
- Tang Z, Wong GKL, Yu P, et al. Room-temperature ultraviolet laser emission from self-assembled ZnO microcrystallite thin films. J Appl Phys Lett. 1998;72(25):3270-72.
- Zhong S. Ren X, Huang Y, et al. Numerical studies on flow and thermal fields in MOCVD reactor, J Chi Sci Bul. 2010;55(6):560-6.
- Nawar AM, Abdel AN, Said NF, et al. Improving the optical and electrical properties of Zinc Oxide thin film by Cupric Oxide dopant. J App Phys. 2014;6(4)17-22.
- Das B, Das T, Parashar K, et al. Structural, electrical and FT-IR studies of nano Zn<sub>1-x</sub>Ca<sub>x</sub>O by solid state reaction method. Appl Sci Adv Mat Int. 2014;116.
- Shalan AE, Osama I, Rashad MM, et al. An investigation on the properties of SnO2 nanoparticles synthesized using two different methods. J Mat Sci: Mat Elec. 2014;25(1)303-10.
- Mead DG, Wilkinson GR. The temperature dependence of the Raman effect in some wurtzite type crystals. J Ram Spec. 1977;6(3)123-29.
- Ekambaram S. Combustion synthesis and characterization of new class of ZnO-based ceramic pigments. J Alloys Comp. 2005;390(1): L4-L6.
- Duan LB, Rao GH, Wang YC, et al. Magnetization and Raman scattering studies of (Co, Mn) codoped ZnO nanoparticles. J App Phys. 2008;104(1):013909.
- 27 Liu M, Yang J, Feng S, et al. Composite photoanodes of Zn2SnO4 nanoparticles modified SnO2 hierarchical microspheres for dye-sensitized solar cells. Mater Lett. 2012;76:215-18.
- Prashant SK, Dutta RK, Pandey AC. Effect of nickel doping concentration on structural and magnetic properties of ultrafine diluted magnetic semiconductor ZnO nanoparticles. J Mag Mag Mat. 2009;321(20)3457-3461.
- Roman V, Iatsunsky I, Fedorenko V, et al. Enhancement of electronic and optical properties of ZnO/Al2O3 nanolaminate coated electrospun nanofiber. J Phys Chem. 2016;120(9):5124-32.
- Karam C, Guerra NC, R. Habchi Z, et al. Urchin-inspired ZnO-TiO 2 core-shell as building blocks for dye sensitized solar cells. J Mat Des. 2017;126:314-21.
