Research
, Volume: 12( 3)Study of Lipid Profile and Apolipoprotein A-1 in Type 2 Diabetes Mellitus Subjects and Normal Healthy Controls
- *Correspondence:
- M Prasad Naidu , Department of Biochemistry, Narayana Medical College and Hospital, Nellore, Andhra Pradesh, 52400, India, Tel: +918801527888; E-Mail: drmprasadnaidubio@gmail.com.
Received: August 13, 2018; Accepted: September 28, 2018; Published: October 8, 2018
Citation: Bharathi KP, Shivakumar, Aruna P, et al. Study of Lipid Profile and Apolipoprotein A-1 in Type 2 Diabetes Mellitus Subjects and Normal Healthy Controls. Biochem Ind J. 2018;12(3):133
Abstract
Diabetes looks different in different patients. The signs and symptoms, severity and also type of diabetes can vary. But one thing is always the hyperglycemia. This study aim estimation of Fasting blood glucose, Post prandial blood glucose, Total Cholesterol, Triglycerides, High Density of Lipoproteins-Cholesterol, Low Density of Lipoproteins-Cholesterol, Very Low Density Lipoproteins-cholesterol, Apolipoprotein A-1(apo A-1) levels in type 2 diabetes mellitus cases and normal healthy controls. 50 T2DM cases and 50 age matched healthy controls. The mean and standard deviation were calculated for all the Biochemical parameters. The significance between the groups were determined using Student t- test for Equality of means. The p-value of < 0.05 was considered significant. This study report to measuring apolipoprotein-A1 levels are useful for early detection of atherosclerosis even before the inflammation sets in and the treatment directed towards increasing the apo A-1 levels may prevent the morbidity and mortality occurring due to coronary artery atherosclerosis.
Keywords
Apolipoprotein-A; Diabetes Mellitus; Lipid profile; Coronary artery atherosclerosis
Introduction
Epidemiological studies indicate that diabetes mellitus can accelerate atherosclerotic processes and increase the incidence of cardiovascular events and strokes. Diabetes looks different in different patients. The signs and symptoms, severity and also type of diabetes can vary. But one thing is always the hyperglycemia [1-4]. Apolipoprotein A-1 (apo A-1) is the major protein component of High-Density Lipoprotein [5,6].
In both the fasting and post-prandial states, reduced action of insulin on adipocytes results in reduced suppression of lipolysis, that is reduced suppression of hydrolysis of stored triacylglycerol, and so greater release of non-esterified fatty acids (NEFA). The resulting increased NEFA delivery to the liver increases hepatic triacylglycerol production which in turn serves to drive hepatic VLDL production. In both the fasting and post-prandial states, reduced action of insulin on hepatocytes results in reduced suppression of VLDL production [7].
Therefore, in the presence of increased triacylglycerol-rich lipoproteins, Cholesterol Ester Transfer Protein (CETP) activity is increased so that all circulating lipoproteins become enriched in triacylglycerol, in particular HDL and LDL particles. LDL particles that are triacylglycerol enriched due to the hypertriglyceridemia and increased CETP activity are also converted by the triglyceride lipase activity of hepatic lipase into smaller and denser particles [8]. Whereas large buoyant LDL is cleared rapidly by the LDL receptor pathway and small dense LDL is removed more slowly. Small dense LDL particles are more easily modified by oxidation, glycation, and are more atherogenic. Glycated and/or oxidized LDL have demonstrated adverse effects on vascular cell viability, lipid accumulation, growth factor expression and intracellular oxidative stress [9]. Triacylglycerol-rich HDL particles are converted by the triglyceride lipase activity of hepatic lipase into smaller particles which are better substrates for catabolic pathways [10].
In the insulin resistant hypertriglyceridemic state, HDL particles tend to be small and dense and so more likely to undergo catabolism, so that HDL particle numbers and HDL-c concentrations are reduced [11].
A recent study shows an increased catabolism of HDL apoA-I to be completely responsible for the lower HDL concentrations in NIDDM with a pronounced diabetic dyslipidemia (hypertriglyceridemia and low HDL cholesterol). Apo A-1 is the major structural protein of HDL and accounts for ∼70% of total HDL protein. Its molecular mass is 28 kDa. Apolipoprotein A-1 is also produced directly from the liver and to a lesser extent from intestine and associates with phospholipid to form nascent HDL [12]. “The potential mechanisms of the cardio protective effects of apoA-I include.” Enhancement of reverse cholesterol transport, FIG. 1. Attenuation of oxidative stress, increased peraoxonase activity, Enhanced anticoagulantactivity and Regulate vascular tone through nitric oxide (NO) [13,14].
Other Atheroprotective effects: Anti-inflammatory effect of apo A-I is by inhibiting neutrophil activation, adhesion, spreading and migration [15-17]. It was recently reported that apo A-I could upregulate the activity of endothelial nitric oxide synthase (eNOS), likely through specific phosphorylation of AMP-Activated Protein Kinase (AMPK) in endothelial cells.
The present study was estimation of Fasting blood glucose, Post prandial blood glucose, Total Cholesterol, Triglycerides, HDL-Cholesterol, LDL-Cholesterol, VLDL-cholesterol, Apolipoprotein A1(apo A-1) levels in type 2 diabetes mellitus cases and normal healthy controls.
Methodology
This study was operated over a period of 1 year on outpatients attending the General Medicine Department at Narayana Medical College and Hospital, Chinthareddypalem, Nellore, Andhra Pradesh. The study was undertaken on 50 type 2 Diabetes and 50 healthy controls. All of them were in the age group of 35-70 years. Both sexes included. Institutional ethical committee of Narayana Medical College has approved the study and written informed consent collected from the patients. Subjects should have been diabetic for at least one year duration and normal hepatic function and without complications of neuropathy, retinopathy and over nephropathy subjects were included.
Patients on thyroid stimulating drugs, corticosteroids, lipid-lowering drugs, oral contraceptives, aspirin, sulphonamides, smokers, chronic alcoholics and pregnant women were excluded. This study estimated parameters are; Fasting blood glucose, Post prandial blood glucose,Total Cholesterol, Triglycerides, HDL-Cholesterol, LDL-Cholesterol, VLDL-cholesterol, Apolipoprotein A1(apo A-1) levels.
Specimen collection
Subjects under this study were advised to fast overnight (twelve hours). Blood were taken in fasting condition. 5 ml venous blood samples were taken from the each person and it was transferred to the Plain tube and serum is abstracted by centrifugation and stored at -200°C to measure the analytes.
Plasma glucose was determined by the glucose oxidase and peroxidase method using a commercially available kit Human (gmbh Germany) using Humastar 300 chemistry analyzer (Human gmbh Germany. Total cholesterol, triglycerides and HDL-cholesterol were measured using reagent kits from Human (gmbh Germany) using Humastar 300 chemistry analyser (Human gmbh Germany).
Cholesterol oxidase-Peroxidase method: (CHOD-POD) Enzymatic colorimetric test for cholesterol with lipid clearing factor (LCF). The cholesterol is determined after enzymatic hydrolysis and oxidation. The indictor quinoneimine is formed from the H2O2 and 4- aminophenazone in the presence of phenol and peroxidase. Reference Values: 150 mg/dl -200 mg/dl.
Desirable: up to 200 mg/dl, Borderline High: 200-239 mg/dl and High: >240 mg/dl. Estimation of HDL Cholesterol by Homogenous Enzymatic Assay, HDL-C fraction can be determined after precipitating other lipoproteins using precipitating reagents and HDL-C is measured in supernatant.
Estimation of Triacylglycerol by GPO-PAP Enzymatic colorimetric test for triacylglycerols with Lipid Clearing Factor (LCF). Triacylglycerols are determined after enzymatic hydrolysis with lipases. Indicator is quinoneimine formed from H2O2. 4-aminopyrine and 4-cholorophenol under the catalytic influence of peroxide. Normal Values: 80 mg/dl -160 mg/dl, Borderline High: 150 mg/dl -199 mg/dl, High: 200 mg/dl-499 mg/dl and Very High : >500 mg/dl. LDL-cholesterol was calculated using Friedwalde’s equation. LDL=total cholesterol-HDL cholesterol-Triglyceride/5 and Normal level: 80 mg/dl-150 mg/dl. Estimation of VLDL Cholesterol; VLDL-C was calculated by dividing the triacylglycerol concentration by 5.
Estimation of apolipoprotein A-1: Serum Apo A-1 was determined by the turbidomtric immunoassay using commercially available kit (Erba Mannheim) and Humastar 300 chemistry analyzer (Human gmbh Germany). Measurement of antigen-antibody reaction by the end-point method. Reagentsare 0.9 g % sodium chloride, Antiserum, Phosphate buffered saline (pH 7.43). Polyclonal goat anti-human Apolipoproteins A-1 (variable), Sodium azide (0.09%) and Buffer Phosphate buffered saline (pH 7.43). Polyethylene glycol (60 g/l), Detergent (0.1%), Sodium azide (0.09%), Calibrator: Defibrinated pooled human plasma, liquid and stabilized. Contains 0.09% sodium azide, Preparation and Stability of Reagents, Reagent Preparation Liquid reagents, ready for use Stability and Storage. The reagents are stable until expiry date when kept at 2-8°C. Stability in the instrument is at least 4 weeks if contamination is avoided. Do not freeze. Sample collection by use fresh serum. If the test cannot be carried out on the same day, the serum may be stored at 2°C -8°C for 48 hours. If stored for a longer period, the sample should be frozen. Calculate ▲OD's, plot a standard curve and read the concentration of controls and samples.
Manual procedure: Sample/Control dilution: 1:10 in saline 9 g/l, Reference curve: generate a reference curve by diluting the Calibrator successively 1:10, 1:20, 1:40, 1:80. 1:160 in saline 9 g/l or dilute the Calibrator series 1:10 in saline 9 g/l. Use saline 9 g/l as zero point. Test: Mix 10 pi samples, calibrators and control(s) with 900 pi buffer. Read Optical Density (OD1) of samples, calibrators and control(s) at 340 nm. Add 80 pi Antiserum. Mix and incubate for 5 minutes at room temperature. Read optical density (OD2) of samples, calibrators and control(s) at 340 nm. Calculate ▲ OD’s; plot a standard curve and the concentration of controls and samples. Reference Values in Men: 107 mg/dl-177 mg/dl (IFCC), Women: 107 mg/dl -205 mg/dl, This range is given for orientation only. Each laboratory should establish its own reference values.
Results
Fasting blood glucose, post prandial blood glucose, lipid profile and apo A-1 levels measured in 50 T2DM cases and 50 age matched healthy controls. The mean and standard deviation were calculated for all the Biochemical parameters. The significance between the groups was determined using Student t-test for Equality of means. The p-value is <0.05 obtained for significant TABLE 1.
| S. No. | Parameter | Cases | Controls | P value | t value |
|---|---|---|---|---|---|
| Mean ± S.D. | Mean ± S.D. | ||||
| 1. | Total cholesterol | 174.78 ± 46.52 | 183.72±40.50 | 0.3079 | 1.0249 |
| 2. | TGL | 164.22 ± 95.50 | 115.88 ± 36.97 | 0.0012 | 3.3378 |
| 3. | VLDL | 32.86 ± 19.05 | 23.18 ± 7.39 | 0.0011 | 3.34 |
| 4. | LDL | 99.62 ± 29.20 | 108.5 ± 35.22 | 0.1730 | 1.3725 |
| 5. | HDL | 42.38 ± 12.99 | 51.86 ± 10.35 | <0.0001 | 4.036 |
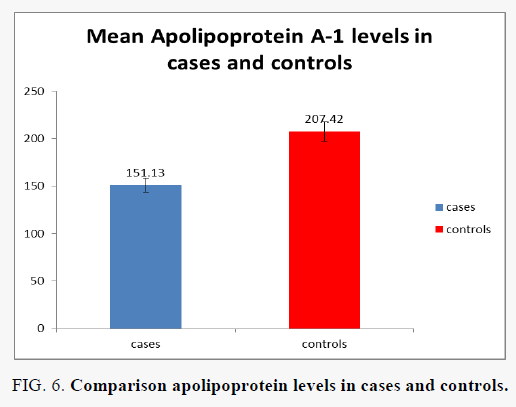
| 6. | apo A-1 | 151.13 ± 37.18 | 207.42 ± 29.35 | <0.0001 | 8.4 |
| 7 | FBS | 158.16 ± 75.1 | 100.74 ± 21.64 | <0.0001 | 5.197 |
| 8. | PPBS | 235.6 ± 96.55 | 149.12 ± 19.17 | < 0.0001 | 6.21 |
Table 1: Biochemical parameters MEAN+SD and P, t value in T2DM and Controls.
Discussion
Diabetes mellitus is a metabolic disorder touching usually carbohydrates and lipid metabolism as a results of deficiency in insulin secretion, insulin action or/both. The metabolic disturbance associated with long standing DM causes secondary pathophysiologic changes in multiple organ systems leading to various life threatening complications like atherosclerosis, retinopathy, neuropathy, nephropathy. The prevalence of type 2 Diabetes is increasing alarmingly worldwide. Coronary artery atherosclerosis is the major cause of mortality among diabetes population. Diabetes mellitus can accelerate atherosclerotic processes.
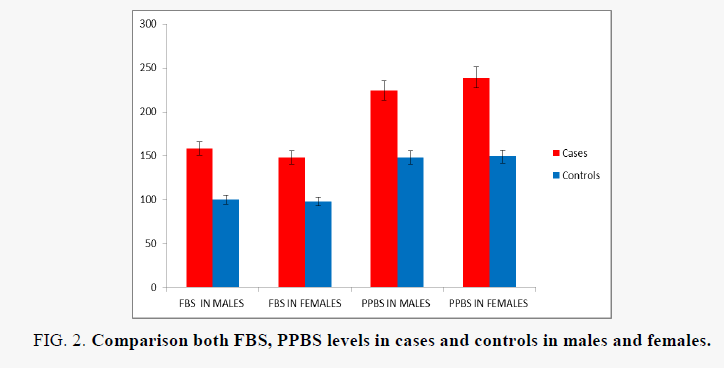
The study is aimed at “Estimation of lipid profile Apo A-1 Type 2 DM Subjects”. The present study included 100 subjects. Among them 50 were type 2 diabetes cases and 50 were healthy controls FIG. 2. In both cases and controls lipid profile, apolipoprotein A-1 and high- Sensitivity C-Reactive Protein levels measured.
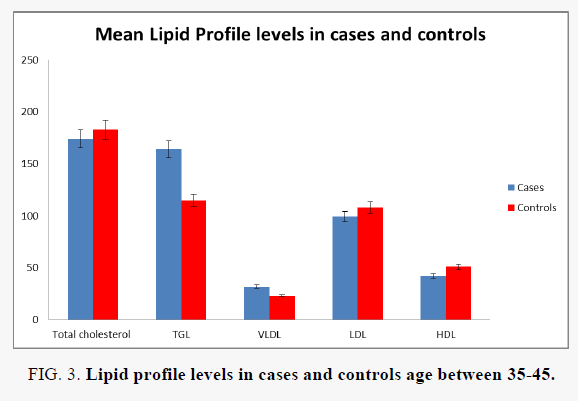
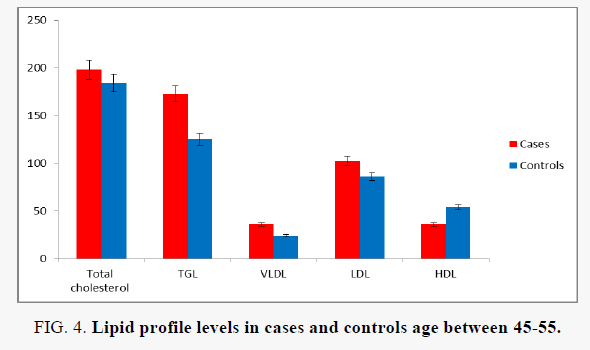
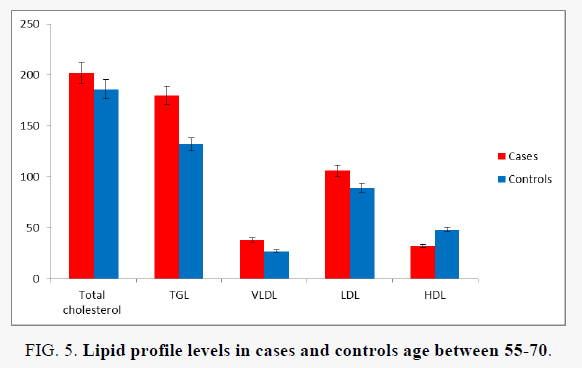
In the present study FIG. 3-5 the mean value and standard deviation of TC in cases were 174.78 ± 46.52 and in controls were 183.72 ± 40.50. This results shows not significant (p=0.3079). The mean value and standard deviation of TG in cases were 164.22 ± 95.50 and in controls were 115.88 ± 36.97. This increase was statistically significant (P=0.0012).
The mean value and standard deviation of VLDL in cases were 32.86 ± 19.05 and in controls were 23.18 ± 7.39. This increase was statistically significant (P=0.0011). The mean value and standard deviation of LDL in cases were 99.62 ± 29.20 and in controls were 108.5 ± 35.22. This decrease was not statistically significant (P=0.173). The mean value and standard deviation of HDL in cases were 42.38 ± 12.99 and in controls were 51.86 ± 10.35. This decrease was statistically significant (P=0.0001). This results can be due to low insulin effects above liver apolipoprotein synthesis FIG. 6, decreased regulation of LPL as opposing directed toward hepatic lipase, elevated cholesteryl ester transfer protein (CETP) activity, and lowperipheral actions of insulin above adipose tissue ( elevated lipolysis) and muscle (low uptake of FFA). This study is in accordance with Michael B. Adinorteyet al, [18] and Ayaz K Mallick1 Ravindra Maradi et al [19].
Apo LP A-1 one of the main structural HDL Apo LP and for ∼70% of overall HDL protein. In our study results apo A-1 in Type 2 Diabetes Mellitus Subjects were 151.13 ± 37.18 and in normal healthy subjects were 201.42 ± 29.35. This decrease was statistically significant (P=0.0003). Here the decreased apo A-1 attributable to the increased fractional clearance of apo A-1. The mil hyper Triglycerides and Low density lipoprotein is especially small and also dense it can major for susceptible to the oxidation. Chronic hyperglycemia cooperates with the glycation of Low density lipoprotein cholesterol and both this mechanisms were believed to elevate the atherogenicity of LDL-C. RCT is a pathway removing excess cholesterol from extra-hepatic cells, most importantly vascular cells, thus protecting against development of atherosclerosis. Cholesterol efflux is the first and most likely the rate-limiting step of reverse cholesterol transport. Cholesterol efflux to apo A-1 may compose a prominent addition to cholesterol export from macrophages. Apo A-I has antioxidative activity, it prevents and/or delay Low density Lipoprotein oxidation by removing oxidized Phospholipids, including 1-palmitoyl-2. (5-oxovaleroyl)-Sn-glycero-3-phosphorylcholine and 1-palmitoyl-2-glutaroyl-sn-glycero-3-phosphorylcholine, from LDL and also arterial wall of the cells. Apo A-1 accept anti-inflammatory activity. This efficiently inhibit expression of inflammatory arbitrator comparable vascular cell adhesion molecule-1,intercellular adhesion molecule-1, interleukin-1 etc., Therefore decreased Apolipoprotein A-1 levels may play a role in atherosclerosis. This study is in accordance with Jens Pietzsch et.al., [20] Rajni Dawar, Sakshi Singal [21].
Conclusion
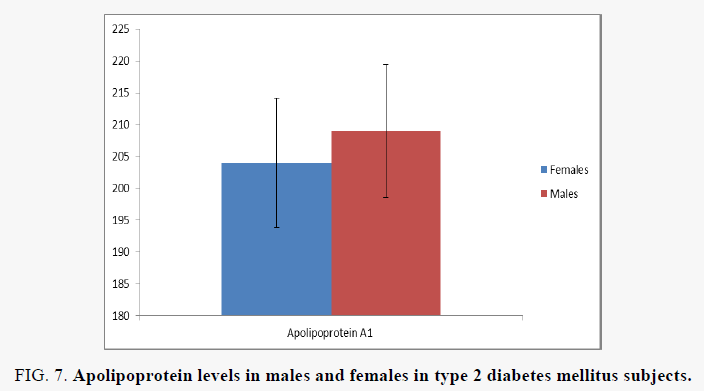
The CAD is the main factor for morbidity and mortality among diabetes mellitus population. Diabetes mellitus can accelerate atherosclerotic processes. The study is aimed at “Estimation of lipid profile and Apo A-1 Type 2 DM Subjects”. In both cases and controls Lipid profile{Total cholesterol, tri-acylglycerols, Very Low Density Lipoprotein-cholesterol (VLDL-C), low density lipoprotein-cholesterol (LDL-C) and high density lipoprotein-cholesterol (HDL- C)} and apolipoprotein-A1(apo A-1). In this study I found that significant decrease in apolipoprotein A-1 levels in T2 DM cases compared with controls FIG. 7. Apo A-1 has anti atherogenic, antioxidant, anti-inflammatory properties and gives protection against atherosclerosis. From this study, I conclude that measuring apolipoprotein-A1 levels are useful for early detection of atherosclerosis even before the inflammation sets in and the treatment directed towards increasing the apo A-1 levels may prevent the morbidity and mortality occurring due to coronary artery atherosclerosis.
Figure 7: Apolipoprotein levels in males and females in type 2 diabetes mellitus subjects.
Acknowledgements
Cooperation with Department of Biochemistry and Central Laboratory, Narayana Medical College and Hospital, Chinthareddypalem, Nellore, Andhra Pradesh.
Conflict of Interest
None declared
References
- Eckel RH, Grundy SM, Zimmet PZ. The metabolic syndrome. The lancet. 2005;365(9468):1415-28.
- Sarnak MJ, Levey AS, Schoolwerth AC, et al. Kidney disease as a risk factor for development of cardiovascular disease: a statement from the American Heart Association Councils on kidney in cardiovascular disease, High blood pressure research, clinical cardiology, and epidemiology and prevention. Circulation. 2003;108(17):2154-69.
- Kanitz MG, Giovannucci SJ, Jones JS, et al. Myocardial infarction in young adults: risk factors and clinical features. J Emerg Med. 1996;14(2):139-45.
- Craig ME, Hattersley A, Donaghue KC. Definition, epidemiology and classification of diabetes in children and adolescents. Pediatric diabetes. 2009;10:3-12.
- Berglund L, Brunzell JD, Goldberg AC, et al. Evaluation and treatment of hypertriglyceridemia: an Endocrine Society clinical practice guideline. J Clin Endocrinol Metab. 2012;97(9):2969-89.
- Sacks FM. The apolipoprotein story. Atherosclerosis supplements. 2006;7(4):23-7.
- Adiels M, Olofsson SO, Taskinen MR, et al. Overproduction of very low-density lipoproteins is the hallmark of the dyslipidemia in the metabolic syndrome. Arteriosclerosis, thrombosis, and vascular biology. 2008;28(7):1225-36.
- Rashid S, Watanabe T, Sakaue T, et al. Mechanisms of HDL lowering in insulin resistant, hypertriglyceridemic states: the combined effect of HDL triglyceride enrichment and elevated hepatic lipase activity. Clin Biochem. 2003;36(6):421-9.
- Reaven PD, Herold DA, Barnett J, et al. Effects of vitamin E on susceptibility of low-density lipoprotein and low-density lipoprotein subfractions to oxidation and on protein glycation in NIDDM. Diabetes care. 1995;18(6):807-16.
- Adiels M, Olofsson SO, Taskinen MR, et al. Overproduction of very low-density lipoproteins is the hallmark of the dyslipidemia in the metabolic syndrome. Arteriosclerosis, thrombosis, and vascular biology. 2008;28(7):1225-36..
- Nesto RW. Beyond low-density lipoprotein. Am J Cardiovasc Drugs. 2005;5(6):379-87.
- Pietzsch J, Julius U, Nitzsche S, et al. In vivo evidence for increased apolipoprotein A-1 catabolism in subjects with impaired glucose tolerance. Diabetes. 1998;47(12):1928-34.
- Ajees AA, Anantharamaiah GM, Mishra VK, et al. Crystal structure of human apolipoprotein AI: insights into its protective effect against cardiovascular diseases. Proc Natl Acad Sci USA. 2006;103(7):2126-31.
- Kontush A, Chapman MJ. Antiatherogenic small, dense HDL-guardian angel of the arterial wall? Nat Rev Cardiol. 2006;3(3):144.
- Nguyen D, Nickel M, Mizuguchi C, et al. Interactions of apolipoprotein A-1 with high-density lipoprotein particles. Biochemistry. 2013;52(11):1963-72.
- Barter PJ, Ballantyne CM, Carmena R, et al. Apo B versus cholesterol in estimating cardiovascular risk and in guiding therapy: report of the thirty-person/ten-country panel. J Intern Med. 2006;259(3):247-58.
- Tan KC. Reverse cholesterol transport in type 2 diabetes mellitus. Diabetes, obesity and metabolism. 2009;11(6):534-43.
- Adinortey MB. Biochemicophysiological mechanisms underlying signs and symptoms associated with diabetes mellitus. Adv Biol Res. 2017;11(5):233-41.
- Mallick AK, Maradi R, Joshi VR, et al. Study on malondialdehyde as a marker of lipid peroxidation in male and female patients with type 2 diabetes mellitus. Int J Pharm Sci Rev Res. 2011;8(2):198-201.
- Pietzsch J, Julius U, Nitzsche S, et al. In vivo evidence for increased apolipoprotein AI catabolism in subjects with impaired glucose tolerance. Diabetes. 1998;47(12):1928-34.
- Dawar R, Gurtoo A, et al. Apolipoprotein A-1 gene polymorphism (G-75A and C+ 83T) in patients with myocardial infarction: a pilot study in a north Indian population. Am J Clin Pathol. 2010;134(2):249-55.

