Original Article
, Volume: 10( 3)Studies on the Interaction of Florfenicol with Bovine Serum Albumin by Fluorescence and Synchronous Fluorescence Spectroscopy.
Mengmeng C, Baosheng L*, Tongtong L and Shaotong D
College of Chemistry & Environmental Science, Hebei University, China
- *Correspondence:
- Baosheng L, Key Laboratory of Analytical Science and Technology of Hebei Province, College of Chemistry & Environmental Science, Hebei University, Baoding, 071002, China E-mail: lbs@hbu.edu.cn
Received: June 23, 2016; Accepted: June 28, 2016; Published: July 26, 2016
Citation: Mengmeng C, Baosheng L, Tongtong L, et al. Studies on the Interaction of Florfenicol with Bovine Serum Albumin by Fluorescence and Synchronous Fluorescence Spectroscopy. Biochem Ind J. 2016;10(3):102.
Abstract
By fluorescence and synchronous fluorescence spectroscopy, the interaction mechanism between florfenicol and bovine serum albumin was investigated at different temperatures. These two methods indicated that florfenicol could lead to flurescence quenching of bovine serum albumin. The process of fluorescence quenching was called static quenching. Electrostatic force bound florfenicol and bovine serum albumin. The order of magnitude about binding constant was up to 104. Binding site was approximately 1. The same conclusion could be obtained from these two different fluorescence spectroscopies.
Keywords
Fluorescence spectroscopy; Bovine serum albumin; Florfenicol; Interaction mechanism
Introduction
Florfenicol [1], a new kind of broad-spectrum antibiotics in chloramphenicol, is used specially for animals. Florfenicol, which was discovered in 1979 by Schering-Plough as a 30-fluorinated derivative of thiamphenicol, has attracted considerable interest from synthetic organic chemists because of its broad-spectrum antibacterial activity [2]. Chemical structure of florfenicol is shown in Figure 1. Compared with the same kind of chloramphenicol and thiamphenicol, antibacterial activity of florfenicol is higher and florfenicol has no potentiality to induce aplastic anemia as well as florfenicol is less toxic for the absence of nitro group and have been suggested as potential substitutes, and thus used extensively in veterinary medicine in recent years [3]. Florfenicol has been listed in several countries and it is mainly used for the treatment on pigs, cows, poultry and fish. It is, therefore, of great importance to develop sensitive and reliable analytical methods capable of monitoring its major metabolite in animals’ bodies.

Figure 1: Chemical structure of florfenicol.
Because the drug-protein interaction may result in the establishment of a stable protein-drug complex, which has important effect on the dispensation, free concentration and the metabolism of a drug in the blood stream and helps to understand the relationship between structures of the protein. The most important function of albumins is that they serve as a depot protein and a transport protein for many exogenous compounds [4,5]. Bovine serum albumin is composed of a single polypeptide chain of 585 amino acid residues, with three α-helical domains (I-III), each containing two sub-domains (A and B). It has two tryptophan residues (Trp-134 and Trp-212) that possess intrinsic fluorescence. So it is possible to study the interaction of albumins with drugs using fluorescence spectroscopy [6]. As the most abundant carriers in the plasma, albumin can be combined with a variety of endogenous and exogenous compounds and is the important target molecules and carrier for drugs to play effect in living organisms. The conventional fluorescence spectroscopy studies the reaction mechanism of small molecule drugs and proteins, mainly by studying the change of fluorescence intensity of protein in the maximum emission wavelength before and after adding the drugs, and derives the binding constants, binding sites and the donor-to-acceptor distance with other information between proteins and drugs. Synchronous fluorescence spectrometry technology was first proposed by Lloyd, and the biggest difference between this and fluorescence measurement method is that the excitation and emission monochromators were scanned simultaneously. Comparing with conventional fluorescence spectroscopy, synchronous fluorescence method has some advantages such as good selectivity, high sensitivity, less interference etc., and it can be used for the simultaneous determination of multi-component mixture. This kind of research method also can be used for studying the interaction between florfenicol and bovine serum albumin.
Experiment
Apparatus
Fluorescence spectra were recorded with a Shimadzu RF-5301PC spectrofluorophotometer. Circular dichroism spectra were recorded on a MOS-450/SFM300 circular dichroism spectrometer (Bio-Logic, France). Absorption spectra were measured with an UV-vis recording spectrophotometer (UV-265, Shimadzu, Japan). All measurements of pH were carried out with a pHS-3C precision acidity meter (Leici, Shanghai, China). All temperatures were controlled by a CS501 superheated water bath (Nantong Science Instrument Factory).
Materials
Florfenicol (FRF) was of the purity grade inferior 98.5%. Bovine serum albumin (BSA) was purchased from Sigma Co. and was of the purity grade inferior 99%. Stock solution of BSA (10 μM) was prepared by dissolving in aqueous solution, the exact concentration of BSA was determined spectrophotometrically using molecular absorption coefficient of ε280 nm=43,800 M-1 cm-1 [7]. The stock solution of FRF (100 μM) was prepared. Tris-HCl buffer solution containing NaCl (0.15 M) was used to keep the pH of the solution at 7.40, and NaCl solution was used to maintain the ionic strength of the solution. Chemicals were all of analytical grade and double-distilled water was used throughout the experiments. All aqueous solutions were stored at 277 K. The fluorescence intensities were corrected for the absorption of excitation light and re-absorption of emitted light to decrease the inner filter using the following relationship [8]:
Fcor=Fobs × e(Aex+Aem)/2 (1)
Where Fcor and Fobs are the corrected and observed fluorescence intensities, respectively, and Aex and Aem are the absorbance values of FRF at excitation and emission wavelengths, respectively. The intensity of fluorescence used in this paper is the corrected fluorescence intensity.
Experiment procedures
1.0 mL Tris-HCl (pH=7.40), 0.3 mL BSA solution (1.0 × 10⁻⁵ M) and different concentrations of FRF were successively added into 10 mL colorimetric tube. The samples were diluted to scaled volume with double-distilled water, mixed thoroughly by shaking, and kept static for 30 min at different temperatures (298 K, 303 K and 310 K). The incident and exit slits were both set at 5 nm. The excitation wavelength was 280 nm and 295 nm, respectively, with a 10 mm path length cell. The solution was subsequently scanned on the fluorophotometer to get emission spectra. In order to record synchronous fluorescence spectra of BSA-FRF system, Δλ value was set for 15 nm and 60 nm. The Δλ represent the different value between the excitation and emission wavelengths.
Result and Discussion
Fluorescence spectra analysis of BSA-FRF system
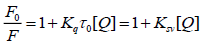
BSA is a kind of protein with endogenous fluorescence due to the presence of amino acids, mainly tryptophan (Trp) and tyrosine (Tyr). BSA of certain concentration is treated as the study object. On this basis, the interaction mechanism of BSA-FRF system could be understood and analyzed. According to the experiment procedure, the fluorescence spectra of BSA-FRF system could be recorded and drawn. The result is shown in Figure 2. With the increasing of concentration of FRF, fluorescence intensity of BSA at 340 nm decreased constantly, which indicated FRF quenched the fluorescence of BSA. In order to study interaction mechanism of BSA-FRF, quenching data obtained by experiment were processed in accordance with the Stern-Volmer equation [9]:
 (2)
(2)

Figure 2: Fluorescence spectrum of FRF-BSA system (T = 298 K, λex = 280 nm).
Where, Ksv is the Stern-Volmer quenching constant, Kq is the quenching rate constant, and [Q] is the concentration of the quencher. F0 and F represent the fluorescence signals in the absence and presence of quencher, respectively. τ0 is the average lifetime of fluorescence without quencher, which is about 10-8 s. According to Eq. 2, based on the linear fit plot of F0/F versus [Q], the Ksv values can be obtained. The results were shown in Table 1.
| λex/(nm) | T/(K) | Kq/(L/mol·s) | Ksv/(L/mol) | r1 | Ka /(L/mol) | n | r2 |
|---|---|---|---|---|---|---|---|
| 280 | 293 | 3.66 × 10¹¹ | 3.66 × 10³ | 0.9981 | 3.69 × 10³ | 0.80 | 0.9982 |
| 303 | 3.26 × 10¹¹ | 3.26 × 10³ | 0.9988 | 3.05 × 10³ | 0.86 | 0.9955 | |
| 310 | 2.62 × 10¹¹ | 2.62 × 10³ | 0.9994 | 2.52 × 10³ | 0.82 | 0.9989 | |
| 295 | 293 | 2.82 × 10¹¹ | 2.82 × 10³ | 0.9980 | 2.77 × 10³ | 0.75 | 0.9964 |
| 303 | 1.63 × 10¹¹ | 1.63 × 10³ | 0.9932 | 1.70 × 10³ | 0.81 | 0.9944 | |
| 310 | 1.06 × 10¹¹ | 1.06 × 10³ | 0.9923 | 1.09 × 10³ | 0.77 | 0.9956 |
Table 1. Quenching reactive parameters of FRF and BSA at different temperatures.
Dynamic quenching process relates to diffusion. As the temperature rises, diffusion coefficient will become larger, thereby increasing quenching constants of the whole system. Static quenching is a process, in which static compounds are formed and the fluorescence of all the system is changed. The increasing temperature may induce the decline of stability of compounds, so that the static quenching rate will decline to some extent [10]. In Table 1, quenching constants decrease orderly along with the increasing temperature, which demonstrates the probable interaction mechanism of BSA-FRF system is static quenching process [11]. New stable compounds are generated during the strong interaction between FRF and BSA molecules. The new compounds can be stored and transported. In addition, all the values of Kq were much greater than the maximum scatter collision quenching constant values of various quenchers (2 × 10¹⁰ M-1 s-1), further suggesting that the quenching mechanism of fluorescence of BSA by FRF is not initiated by dynamic collision but from the formation of a complex [12].
Calculation of binding constants
For static quenching, the relationship between the fluorescence intensity and the concentration of quencher can usually be described using Eq. 3 to obtain the binding constant (Ka) and the number of binging sites (n) [13]:
lg[(F0-F)/F]=n·lg[L]+lg Ka (3)
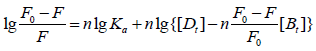
In Eq. 3, Ka and n respectively represent the binding constant and binding site number. [L] represent the concentration of free drug. However, the real free concentration of drug is difficult to determine. So, the total concentration of drug often takes the place of the real free concentration of drug. But, the accuracy of experiment result will be influenced. Consequently, calculation Eq. 4 [14] have been deduced could be used, by which the binding constants and binding site number of interaction between bio-macromolecule and small molecule could be calculated.
 (4)
(4)
Where [Dt] and [Bt] are the total concentrations of FRF and protein, respectively. On the assumption that n in the bracket is equal to 1, the curve of log(F0/F-1) versus log{[L]-n(1-F/F0)[Bt]} is drawn and fitted linearly, then the value of n can be obtained from the slope of the plot. If the value of n is not equal to 1, then it is substituted into the bracket and the curve of log (F0/F-1) versus log {[Dt]-n(1-F/F0)[Bt]} is drawn again. This process is repeated again and again till a single value is obtained for n. On the basis of the value of n obtained, the binding constant Ka can also be determined. The calculation can be completed using a calculator based on the simple program developed, and the results can be obtained by substituting values of F, [Dt] and [Bt]. The results were shown in Table 1. The results showed that all the values of n were approximately equal to 1 at different temperatures, implying that there was just one binding site for FRF existed in BSA. In Table 1, the binding constant Ka is larger than 103, which indicates there is strong interaction between FRF and BSA. And binding site number n is hardly influenced by changing temperature. So, there is stable binding force between BSA and FRF. In blood, serum albumin can store and transport FRF. With the increase of temperature, Ka of BSA-FRF system becomes smaller and smaller, which demonstrates stability of the formed compounds declines with higher temperature. In BSA-FRF system, static quenching process is determined once again [14].
Determination of binding site
When λex=280 nm, fluorescence from Trp and Tyr residues of BSA can be excited at the same time. When λex=295 nm, only the fluorescence from Trp residues can be excited [15]. In the tertiary structure of BSA, Trp residues are mainly located at IB region and IIA region in sub-domains of BSA. However, Tyr residues are mainly located at IB, IIA and IIIA region. So, in hydrophobic sub-domains of BSA, small molecule ligands’ binding site is mainly located at IB region (Trp135, Tyr138, Tyr140, Tyr148, Tyr150, Tyr160), IIA region (Trp214, Tyr263) and IIIA region (Tyr401, Tyr411, Tyr497) [16]. In order to know the participation of Trp and Tyr residues in BSA-FRF system and to determine the specific binding position, fluorescence spectra of BSA-FRF system (λex=280 nm) have been compared with that (λex=295 nm), which was based on “Stern-Volmer equation”. As is shown in Figure 3, the quenching curves of BSA excited at 280 nm and 295 nm did not overlap. The quenching extent of BSA at 280 nm was much greater than that at 295 nm. This phenomenon showed that tryptophan and tyrosine residues both participate in the interaction between FRF and BSA. Also, the binding constants (λex=280 nm) were apparently larger than these (λex=295 nm), which further illustrated that Trp and Tyr residues both took part in reaction in BSA-FRF system. Therefore, it could be inferred that binding site of BSA-FRF system located at IIA region of subdomain.

Figure 3: Quenching curves of BSA-FRF system at λex=280 nm and 295 nm.
Synchronous fluorescence spectra analysis of BSA-FRF system
Synchronous fluorescence spectra can reflect microenvironment of luminous-group molecules. Different difference values between excitation and emission wavelength illustrate different spectroscopy properties. For BSA, when Δλ=15 nm, only the spectroscopy property of Tyr residues can be shown. When Δλ=60 nm, only the spectroscopy property of Trp residues can be shown [17]. By crystal structure research, it can be known that three α-helix structure domains (I, II and III) are included in secondary structures of BSA molecules. Every structure domain can be divided into two sub-domains (A, B) [18]. There are three combination parts for drugs on BSA, one located at sub-domain IIA region (containing Tyr and Trp residues) and two located at IIIA region (containing the Tyr residues) [19]. In order to detect influence of FRF to the conformation of BSA, concentration of BSA was fixed and concentration of FRF were increased gradually. Then, synchronous fluorescence spectra of BSA-FRF system were scanned and recorded, as is shown in Figure 4. It can be seen from Figure 4, fluorescence from Tyr and Trp residues was gradually quenched upon the addition of FRF, and positions of fluorescence peaks had redshift for 2 nm, 5 nm, respectively. The change of fluorescence spectra illustrated that conformation of BSA had been changed [20]. In other words, the interaction between BSA and FRF changed the microenvironment of Tyr and Trp residues, increased the polarity, lowered hydrophobicity, stretched polypeptide chains and loosened the structure of BSA [21]. Therefore, Trp and Tyr residues are both involved in the reaction, and sub-domain IIA region is the binding site. Data about synchronous fluorescence spectra were processed according to the Eq. 2 and 4. Results were presented in Table 2. The value of n is about 1. The value of Ka became smaller upon the increasing of temperature, which indicated the quenching process is static quenching. Tables 1 and 2 and Figure 3 demonstrated that the conclusion obtained from traditional fluorescence spectrometry was in accordance with that obtained from synchronous fluorescence spectrometry.

Figure 4: Synchronous fluorescence spectra of BSA (T=293 K).
| Δ λ/(nm) | T/(K) | Kq/(L/mol·s) | Ksv/(L/mol) | r3 | Ka /(L/mol) | n | r4 |
|---|---|---|---|---|---|---|---|
| 15 | 293 | 2.95 × 10¹¹ | 2.95 × 10³ | 0.9978 | 2.98 × 10³ | 0.88 | 0.9975 |
| 303 | 1.77 × 10¹¹ | 1.77 × 10³ | 0.9952 | 1.96 × 10³ | 0.91 | 0.9968 | |
| 310 | 1.25 × 10¹¹ | 1.25 × 10³ | 0.9944 | 1.34 × 10³ | 0.95 | 0.9984 | |
| 60 | 293 | 3.95 × 10¹¹ | 3.95 × 10³ | 0.9971 | 3.98 × 10³ | 0.87 | 0.9992 |
| 303 | 3.56 × 10¹¹ | 3.56 × 10³ | 0.9975 | 3.87 × 10³ | 0.95 | 0.9972 | |
| 310 | 2.78 × 10¹¹ | 2.78 × 10³ | 0.9990 | 2.65 × 10³ | 0.97 | 0.9993 |
Table 2: Quenching reactive parameters of FRF and BSA at different temperatures.
Type of interaction force in BSA-FRF systems
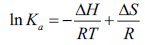
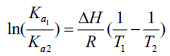
Interaction forces between biomacromolecules and small drug molecules mainly involve hydrogen bonds, hydrophobic forces, van der Waals, electrostatic force [22]. Types of interaction force between BSA and drugs change upon the difference of drugs. It has been known that the quenching process of BSA-FRF system is static quenching. So, the relevant thermodynamic parameters can be calculated and analyzed by substituting Ka at different temperatures into thermodynamic formulas [23]. The interaction force type of BSA-FRF system can be judged from the thermodynamic parameters. When the temperature varies over a small range, ΔH can be considered to be constant. The thermodynamic parameters can be calculated on the basis of van 't Hoff equation [24]:
 (5)
(5)
 (6)
(6)
 (7)
(7)
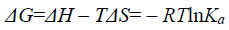
Where, ΔH and ΔS represent the standard variation of the enthalpy and, respectively, entropy of the binding process. R is the gas constant (R=8.314 J mol-1 K-1). T is the thermodynamic temperature. By the thermodynamic standpoint, ΔH>0 and ΔS>0 imply a hydrophobic interaction. ΔH<0 and ΔS<0 reflect the van der Waals force or hydrogen bond formation. And ΔH<0 and ΔS>0 suggest an electrostatic force [25]. According to Eq. 5-7 and the binding constant Ka in different temperatures, the values of ΔH, ΔS and ΔG can be obtained at each temperature, and were listed in Table 3.
| T/(K) | Ka/(L·mol-1) | ΔH/(KJ·mol-1) | ΔS/(J·mol-1·K-1) | ΔG/(KJ·mol-1) | |
|---|---|---|---|---|---|
| λex=280 nm | 293 | 3.69 × 10³ | -16.71 | 11.26 | -20.01 |
| 303 | 3.05 × 10³ | 11.55 | -20.21 | ||
| 310 | 2.52 × 10³ | 11.23 | -20.19 | ||
| Δλ=60nm | 293 | 3.98 × 10³ | -16.78 | 11.64 | -20.19 |
| 303 | 3.87 × 10³ | 13.30 | -20.81 | ||
| 310 | 2.65 × 10³ | 11.42 | -20.32 |
Table 3: The thermodynamic parameters of FRF-BSA at different temperatures.
Being spontaneous reaction or not depends on the value of ΔG. The reduction of ΔH and the increase of ΔS both contribute to spontaneous reaction. That ΔG is negative implied a spontaneous reaction between BSA and FRF. From Table 3, ΔH<0 and ΔS>0 manifest that electrostatic attraction played an important role in the whole system. The conclusions drawn from the synchronous fluorescence method were consistent with the traditional fluorescence quenching method. ΔG calculated when Δλ was 60 nm were smaller than that calculated when λex was 280 nm, which indicated that the spontaneity extent was larger when Δλ=60 nm. This manifests that synchronous fluorescence spectroscopy has higher sensibility than traditional fluorescence spectroscopy.
Conclusion
In this article, interaction between BSA and FRF was studied at different temperatures by two different fluorescence spectroscopies. The two methods used the same equation to process data and had the same conclusion such as the quenching mechanism, type of interaction force and the influence of FRF to the conformation of BSA. The result showed that FRF quenched the fluorescence of BSA by static quenching. Electrostatic attraction was the main driving power in the binding process. In BSA molecules, Tyr and Trp residues both involved in reaction. Synchronous fluorescence spectroscopy has higher sensitivity and can be used widely in the research of reaction mechanism between drug and protein.
Acknowledgements
The authors gratefully acknowledge the financial support of National Science Foundation of China (Grant no. 21375032).
References
- Li X, Xie S, Pan Y, et al. Preparation, characterization and pharmacokinetics of doxycycline hydrochloride and florfenicol polyvinylpyrroliddonemicroparticle entrapped with hydroxypropyl-β-cyclodextrin inclusion complexes suspension. Colloid Surfaces B. 2016;141:634-42.
- Wang XL, Xu LJ, Yan LJ, et al. Catalytic asymmetric transfer hydrogenation/dynamic kinetic resolution: an efficient synthesis of florfenicol. Tetrahedron. 2016;72:1787-93.
- Xiao ZM, Song R, Rao ZH, et al. Development of a subcritical water extraction approach for trace analysis of chloramphenicol, thiamphenicol, florfenicol, and florfenicol amine in poultry tissues. J Chromatogr A. 2015;1418:29-35.
- Malonga H, Neault JF, Tajmir-Riahi HA. Transfer RNA Binding to Human Serum Albumin: A Model for Protein–RNA Interaction. DNA Cell Biol. 2006;25(7):393-8.
- Mancuso C, Bonsignore A, Capone C, et al. Albumin-Bound Bilirubin Interacts with Nitric Oxide by a Redox Mechanism. Antioxid Redox Sign. 2006;8(3-4):487-94.
- Wang YQ, Zhang HM, Zhang GC, et al. Interaction of the flavonoid hesperidin with bovine serum albumin: A fluorescence quenching study. J Lumin. 2007;126(1):211-8.
- Vignesh G, Manojkumar Y, Sugumar K, et al. Spectroscopic investigation on the interaction of some polymer–cobalt (III) complexes with serum albumins. J Lumin. 2015;157:297-302.
- Anbazhagan V, Renganathan R. Study on the binding of 2,3-diazabicyclo[2.2.2]oct-2-ene with bovine serum albumin by fluorescence spectroscopy. J Lumin. 2008;128(9):1454-8.
- Jattinagoudar L, Meti M, Nandibewoor S, et al. Evaluation of the binding interaction between bovine serum albumin and dimethyl fumarate, an anti-inflammatory drug by multispectroscopic methods. SpectrochimActa A. 2016;156(5):164-71.
- Durmus M, Ahsen V. Water-soluble cationic gallium(III) and indium(III) phthalocyanines for photodynamic therapy. J InorgBiochem. 2010;104(3):297-309.
- Naseri A, Hosseini S, Rasoulzadeh F, et al. Interaction of norfloxacin with bovine serum albumin studied by different spectrometric methods; displacement studies, molecular modeling and chemometrics approaches. J Lumin. 2015;157:104-12.
- Shahabadi N, Mohammadpour M. Study on the interaction of sodium morin-5-sulfonate with bovine serum albumin by spectroscopic techniques. SpectrochimActa A. 2012;86(1):191-5.
- Jiang M, Xie MX, Zheng D, et al. Spectroscopic studies on the interaction of cinnamic acid and its hydroxyl derivatives with human serum albumin. J MolStruct. 2004;692(1-2):71-80.
- Bi SY, Pang B, Wang T, et al. Investigation on the interactions of clenbuterol to bovine serum albumin and lysozyme by molecular fluorescence technique. SpectrochimActa A. 2014;120:456-61.
- Han R, Liu BS, Li GX, et al. Investigation on the interaction of cefpirome sulfate with lysozyme by fluorescence quenching spectroscopy and synchronous fluorescence spectroscopy. Luminescence. 2016;31(2):580-6.
- Sułkowska A, Maciazek M, Rŏwnicka J, et al. Effect of temperature on the methotrexate-BSA interaction: Spectroscopic study. J MolStruct 2007;834(S1):162-9.
- Miller JN. Recent advances in molecular luminescence analysis. Proc Anal DivChem Soc. 1979;16:203-8.
- Sudha N, Sameena Y, Chandrasekaran S, et al. Alteration of the binding strength of dronedarone with bovine serum albumin by β-cyclodextrin: a spectroscopic study. Spectrosc Lett. 2014;48:112-9.
- Du W, Teng T, Zhou CC, et al. Spectroscopic studies on the interaction of bovine serum albumin with ginkgolic acid: Binding characteristics and structural analysis. J Lumin. 2012;132(5):1207-14.
- Fang YY, Yang XM, Li YY, et al. Spectroscopic studies on the interaction of bovine serum albumin with Ginkgol C15:1 from Ginkgo biloba L. J Lumin. 2015;162:203-11.
- Zhang XH, Lin Y, Liu L, et al. Study on the synthesis of sulfonamide derivatives and their interaction with bovine serum albumin. Luminescence. 2015;30(3):269-79.
- Li L, Lin R, He H, et al. Gao. Interaction of amidated single-walled carbon nanotubes with protein by multiple spectroscopic methods. J Lumin. 2014;145:125-31.
- Ross PD, Subramanian S. Thermodynamics of protein association reactions: forces contributing to stability. Biochemistry 1981;20(11):3096-102.
- Guo XJ, Li XZ, Jiang YC, et al. A spectroscopic study on the interaction between p-nitrophenol and bovine serum albumin. J Lumin2014;149:353-60.
- He LL, Wang X, Liu B, et al. Study on the interaction between promethazine hydrochloride and bovine serum albumin by fluorescence spectroscopy. J Lumin. 2011;131(2):285-90.