Original Article
, Volume: 13( 2)Studies on the Dynamic Behaviour and Hydraulic Characteristics of a Water Distillation Column
Rupsha Bhattacharyya* and Kalyan Bhanja
Heavy Water Division, Bhabha Atomic Research Centre, Trombay, Mumbai-400 085, Maharashtra, India
- *Corresponding Author:
- Rupsha Bhattacharyya
Heavy Water Division, Bhabha Atomic Research Centre
Trombay, Mumbai-400 085, Maharashtra, India
Tel: +91-022-2559-2962
E-mail: rupshabhattacharyya1986@gmail.com
Received Date: July 02, 2018; Accepted Date: July 27, 2018; Published Date: August 03, 2018
Citation: Bhattacharyya R, Bhanja K. Studies on the Dynamic Behaviour and Hydraulic Characteristics of a Water Distillation Column. Chem Technol Ind J. 2018;13(2):125.
Abstract
Heavy water (D2O) is used as the moderator as well as the coolant in pressurized heavy water nuclear reactors (PHWRs). To ensure neutron economy and best moderator performance, the isotopic purity of heavy water has to be ensured at about 99.95 % and above at all times during reactor operation. Vacuum distillation is the most widely practiced method for heavy water enrichment to nuclear reactor grade from pre concentrated (15% or more D2O in H2O) feed. A simple, versatile mathematical model for simulating the dynamic behaviour of such a column is presented in this work. Liquid hold up, pressure drop and flooding point calculations have been performed for the tower using known packing characteristics and fluid properties. To simulate the column performance, it has been modeled as an equivalent tray tower using a known value of the height equivalent to theoretical plate (HETP) and its dynamic behaviour under total reflux operation as well as its separation performance under continuous feeding with product withdrawal is predicted. The effect of parameters like temperature, reflux ratio, feed point location and feed composition on the final isotopic purity of top and bottom products at steady state has also been studied.
Keywords
Dynamic simulation; Heavy water; Vacuum distillation; Isotopic purity
Introduction
Heavy water is water in which the content of deuterium (H21), present as D2O and HDO is more than the natural proportion of about 150 parts per million (ppm). It is an isotopic form of water and therefore it is chemically similar to light water (H2O) but the two species have slight differences in boiling point and other physical properties [1]. Heavy water is an integral part of nuclear power generation systems which use natural uranium (as uranium oxide) as fuel because of its very good neutron moderating power and extremely low neutron capture cross section. Moreover it is also used as the coolant to remove nuclear heat from the reactor core, which is then used to generate steam and subsequently electricity [2]. During normal operations the heavy water moderator and coolant get contaminated by light water from the humidity in ambient air or from any sources of leakage. This is detrimental to the moderating power of heavy water as light water seriously affects neutron economy in the core (i.e. hydrogen in light water absorbs neutrons parasitically to a far greater extent than deuterium). So the moderator/coolant needs to be upgraded and it is also achieved by vacuum distillation (which is the same process as final enrichment of heavy water during its production from light water) to at least 99.9 % deuterium [3,4]. Isotopic purity is defined here as the ratio D/(D+H) i.e. the atoms of deuterium present in a mixture of deuterium and hydrogen atoms. The purification of heavy water is carried out in a vacuum distillation column since the relative volatility or the separation factor achieved under vacuum is greater than that obtained at lower pressure. Since the difference in the molar masses of heavy water and light water is not too much (20 gm/mol and 18 gm/mol respectively) the difference in their boiling points at any given pressure and consequently the separation factor is also low and a heavy water distillation tower requires a large packed height even with high efficiency structured packing, which is equivalent to several hundred trays in a single column. Moreover this is a high purity separation since the feed itself may be of more than 90% isotopic purity, which further raises the equivalent number of trays required. Minimizing the loss of valuable D2O through the top product (which is essentially a reject stream of light water) is another requirement to be taken care of during purification.
A distillation column is typically operated under steady state conditions but there are always various factors which lead to a dynamic or time dependent behaviour of the system. Such behaviour occurs when the column is started up or shut down and it is then important to know the characteristics of the system under these transient conditions. Apart from these situations there is always the possibility that the column operation is affected by some disturbance that originates upstream of the column. Additionally, it might be necessary to change the throughput to the tower or modify the operating conditions or the product specifications. All these lead to dynamic behaviour of the column. A dynamic simulation study of the distillation column is also necessary to establish a proper control strategy for the tower so that it does not produce off-specification products for too long. Selection of the optimum operating conditions for the tower and minimizing the cost of running the column are accomplished by an understanding the dynamic state of the columns.
In the present work a simple, dynamic, equilibrium based mathematical model of a vacuum distillation column for heavy water is presented. While steady state, algebraic models have been developed for upgrading column simulation [5-9] the dynamic behaviour of these columns is also important and this has been addressed in this work. The model consists of a set of coupled ordinary differential equations representing the material balance, along with the vapour liquid equilibrium relationship, which have been integrated over time using standard techniques. The model represents the tower as a tray tower by using known values of the HETP for the particular type of packing and gas and liquid flow rates used. Parametric studies have been performed to understand the effects of design and operating parameters on the separation achieved in a given tower. A simple model such as the one presented has the advantage that it can be solved using in-house codes developed by the particular end-user, without depending on expensive commercially available process simulation packages, which very often do not have complete phase equilibrium data for isotopic systems such as the one considered here. Moreover the solution of sets of simultaneous algebraic equations, which is required to be done in steady state models of multi-component distillation columns, often leads to convergence and numerical instability issues. But for solving sets of first order, non-linear, ordinary differential equations from an initial composition profile using a ‘time-marching’ algorithm, much less numerical hassles are encountered and ultimately required steady state compositions are predicted from a given initial condition. Thus the unsteady state model is also more versatile in its application than a steady state one.
The technology of water distillation to produce heavy water enriched product is well known globally and mature. It is of special importance and of economic significance to the Indian nuclear power program which is mainly based on pressurized heavy water reactors. This scenario is expected to continue for the next few decades as well. Thus a fresh analysis of water distillation systems to obtain better insights into their work is essential. This work tries to make an attempt in this area.
Thermodynamic properties of the light water-heavy water isotopic system
The light water-heavy water system consists of at least three species in liquid or vapour phase. These three species are H2O, D2O and HDO [10]. The last species is formed by the isotopic exchange reaction (which takes place in both liquid and vapour phases) which is represented as
H2O+D2O ↔ 2HDO (2.1)
It is assumed in the present study that the heavy water to be upgraded does not contain any tritiated forms of water and hence the mixture to be purified has been considered as a ternary system with H2O, D2O and HDO existing independently in the gas and liquid phases. Inclusion of tritiated water species in the model is a simple extension of the problem being addressed here. It is required to recover D2O in the bottoms stream in as pure a form as possible i.e. the isotopic purity of the bottom stream has to be commensurate with the minimum required purity levels in nuclear reactors. The top stream, which too contains some amount of deuterium, is not considered to be separated further in this work (i.e. only a single distillation column is assumed to be available) though practically deuterium recovery from this stream in another column could also have potential economic benefits.
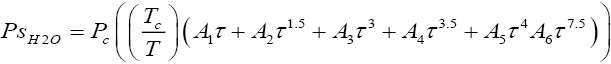
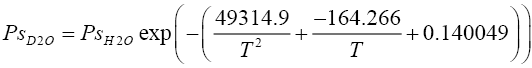
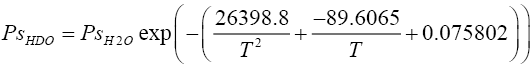
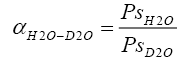
The vapour pressures of isotopic water species were obtained from equations (2.2)-(2.5) respectively and they were used to calculate the relative volatilities as the ratio of saturation vapour pressure of each component in the mixture to that of a reference component (in this case D2O ) at a particular temperature [10,11].
Vapour pressure of light water (H2O):
 (2.2)
(2.2)
The values of constants A1 to A6 are as follows:
A1 = -7.85823, A2 = 1.83991, A3 = -11.7811, A4 = 22.6705, A5 = -15.9393, A6 = 1.77516, Tc = 647.14 K, Pc = 22.064 MPa.
The quantity τ is defined as
 (2.3)
(2.3)
Vapour pressure of heavy water species (HDO and D2O ):
 (2.4)
(2.4)
 (2.5)
(2.5)
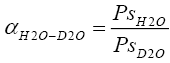
Relative volatilities were defined as
 (2.6)
(2.6)
 (2.7)
(2.7)
The mixture was assumed to be ideal in both the liquid and vapour phases. This assumption is valid given that the tower typically operates under a vacuum of 120 to 200 mm Hg (absolute) and the liquid phase consists of isotopic species which are chemically very similar and are quite close-boiling components. Thus interactions between these species leading to non-ideal effects in solution are unlikely. So the pure component critical properties and vapour pressure data for each species can provide adequate measures of the relative volatilities of the components in the mixture. A constant relative volatility, which is the geometric mean of the top and bottom relative volatilities, has been taken for each species considered in the mathematical model and it has been used in solving the coupled material balance and equilibrium equations.
Hydrodynamic Features of the Heavy Water Distillation Column
The distillation of heavy water is typically carried out in packed towers with countercurrent flow of vapour and liquid under vacuum. High efficiency corrugated metal wire mesh type of packing has been assumed to be used for the distillation column. In the present study, all calculations are performed assuming a tray column which provides a separation performance equivalent to the actual packed column, based on available HETP data for the type of packing considered here [12]. Typical design and range of operating data for the heavy water distillation tower considered in this work are presented in TABLE 1. The tray configuration used to write the unsteady state material balances indicated in Section 4 is shown in FIG. 1.
| Serial Number | Parameter | Value |
|---|---|---|
| 1 | Tower internal diameter | 1.05 m |
| 2 | Packed height | 35 m |
| 3 | Type of packing | Corrugated metal wire gauze structured packing |
| 4 | HETP | 0.08 m |
| 5 | Number of equivalent trays | 437 |
| 6 | Corrugation angle | 60o with horizontal |
| 7 | Side dimension of corrugation | 0.009 m |
| 8 | Specific surface area of packing | 700 m2/m3 |
| 9 | Packing void fraction | 0.85 |
| 10 | Packing factor | 21 m2/m3 |
| 11 | Cs | 2.5 |
| 12 | Cfl | 2.25 |
| 13 | Average liquid density | 983 kg/m3 |
| 14 | Average liquid viscosity | 500*10-6 Pa s |
| 15 | Average liquid surface tension | 0.0663 N m-1 |
| 16 | Feed flow rate | 40 LPH |
| 17 | Feed isotopic purity | 90-98 % |
| 18 | Feed condition | Saturated vapour (q = 0) |
| 19 | Desired bottom product isotopic purity | 99.95% |
| 20 | D2O % in top product | 0.10% |
TABLE 1. Design and operating parameters for distillation column performance simulation [12,21,14].

FIG. 1: Schematic diagram of the hypothetical feed tray used to derive material balance equations for simulation.
Calculation of liquid hold up in the column
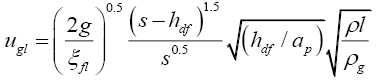
The dynamic liquid hold up in the column was estimated using the following available correlation [13]:
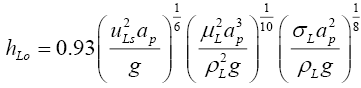 (3.1)
(3.1)
Equation (3.1) was used to determine the total liquid hold up for the column, which was then divided by the equivalent number of trays to obtain the liquid hold up per tray. The hold ups in the reboiler and condensor are generally expected to be more than that on individual trays, so these were taken as twice the tray hold up calculated above. All hold ups were assumed to remain constant during the operation of the column. The physical properties of D2O (liquid) were used to evaluate the hold up from Equation (3.1) [14].
Pressure drop characteristics of the column
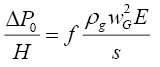
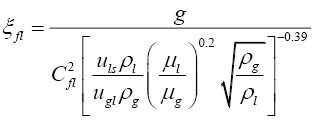
The calculation of pressure drop through the packed tower consists of first evaluating the pressure drop in dry condition assuming only the vapour to be flowing, followed by correcting it for the flow of the liquid and the liquid hold up in the irrigated column. Equations (3.2) to (3.5) were used for pressure drop calculation for the structured packing used in the distillation columns [12].
Pressure drop per unit length through dry packing was calculated as
 (3.2)
(3.2)
where
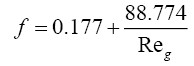 (3.3)
(3.3)
and
 (3.4)
(3.4)
Pressure drop through the irrigated column was calculated from
 (3.5)
(3.5)
where K2=0.614+71.35S
The pressure drop at flooding was evaluated from equation (3.6) [15].

 (3.6)
(3.6)
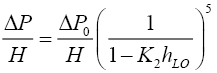
Using the parameters reported in TABLE 1, the pressure drop per metre of packing through the distillation tower has been calculated at various values of the reflux ratio (i.e. various possible combinations of gas and liquid flow rates through the column) at a given total feed flow rate and presented in FIG. 2. It can be seen that for the typical range of flow rates and the total height of packing considered to be present in the tower in this work, the total pressure drop under irrigated conditions amounts to about 14 mm of Hg. This in turn means that the bottom temperature of the tower is about 1 to 1.5°C higher than the top temperature. Thus the arithmetic mean of the top and bottom temperatures can be safely assumed as the constant average column operating temperature for the simulation studies with only a small negligible temperature gradient prevailing inside the column.

FIG. 2: Pressure drop through the distillation column as a function of reflux ratio and feed flow rate for given top and bottom liquid compositions (T = 333 K, feed IP = 98%, top IP = 0.1%, bottom IP = 99.95%).
FIG. 2 enables one to theoretically estimate the allowable limits of gas and liquid flows in the tower below the flooding point in terms of the maximum allowed reflux ratio. The pressure drop at flood point only depends on the type of packing material and thus it remains constant at every value of the reflux ratio and feed flow rate considered. Most packed towers with high efficiency packing can operate at vapour velocities of 70 to 80% of flooding velocity, though for vacuum distillation operation, the limit is conservatively set at 50% of the flooding velocity. FIG. 2 shows the maximum allowable reflux ratio for each feed flow rate, so that the pressure drop remains at 80% of the flooding pressure drop. As can be seen, the limiting values of reflux ratio necessary to cause this level of pressure drop are very high. This seems to indicate that even under practically total reflux conditions (i.e. at high liquid boil up rates and consequently high vapour condensation rates with low top product withdrawal), the column is not likely to get flooded. Thus the column can take up higher feed throughputs for the same diameter.
Loading and flooding point characteristics of the column
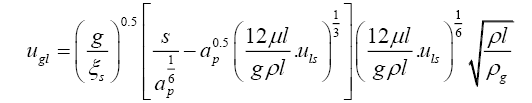
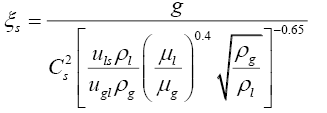
Several correlations have been proposed in literature for the calculation of loading and flooding vapour velocities in a packed column [12,15,16]. Iterative calculations using Equations (3.7) and (3.8) were performed to determine the loading point vapour velocity for a given liquid superficial velocity [12]. Liquid and vapour velocities inside the column were related to the specified feed flow rate, feed quality, the top and bottom product flow rates calculated on the basis of an assumed component split and the chosen reflux ratio above the minimum required value. Vapour and liquid properties were evaluated at a temperature of 333 K, assuming liquid at bubble point and vapour at dew point.
 (3.7)
(3.7)
 (3.8)
(3.8)
Similarly for the calculation of flooding point gas velocity, iterative calculations were done using Equations (3.9) to (3.11).
 (3.9)
(3.9)
 (3.10)
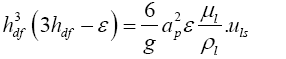 (3.11)
Typical results of both loading and flooding point calculations for the column are shown in FIG. 3. This gives an idea of the allowable vapour velocities for chosen liquid velocities in the packed sections of the column.

FIG. 3: Gas velocity at loading and flooding points as a function of liquid velocity in the distillation column (T = 333 K).
Evaluation of minimum wetting rate for the column
The minimum wetting rate in the distillation column was calculated from Equation 3.12 [13].
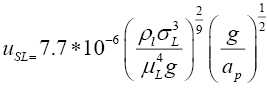 (3.12)
It can be easily shown that the liquid flow rates prevailing in the tower are much above the calculated minimum rate required for wetting the packing, so efficient gas-liquid contact over the surface area provided by the packing can take place in practice.
Fenske-Underwood-Gilliland (FUG) calculations for heavy water distillation column
The FUG calculations provide us with some starting point (e.g. assumed top and bottom compositions, initial composition profile or reflux ratios to be considered) for the more detailed tray to tray simulations in case of multi-component distillation [13,17]. These calculations were performed for the heavy water distillation column for some typical desired conditions following the algorithm described in TABLE 2 and the results are presented in TABLE 3. Along with the separation performance, the hydraulic behaviour of the column has also been incorporated in this modified form of the short cut calculations. Additionally these calculations helped establish the adequacy of the tower height for the desired separation under chosen operating conditions, since the theoretical number of trays required is much less than the available number of trays based on total packed height in the column. Also the pressure drop at actual conditions is much less than the pressure drop at flooding conditions, therefore showing that the column design is also hydrodynamically sound for the expected range of operating conditions. The short-cut calculations also help in establishing the limits of operability of the given column e.g. minimum feed IP that can be handled at the design feed flow rate and product compositions etc. It has been determined that downgraded heavy water having feed IP of upto 70% can be handled in the column at 40 LPH feed flow rate while remaining safely away from flooding limits.
| Step Number | Calculation/Specification |
|---|---|
| 1 | Select feed flow rate, feed isotopic purity, top and bottom product isotopic purity (IP) desired |
| 2 | Select feed temperature, feed quality, condenser pressure |
| 3 | Calculate dew point of distillate at top product IP and selected condenser pressure |
| 4 | Assume value of pressure drop through the column and calculate reboiler pressure |
| 5 | Calculate bubble point of bottoms product at bottom product IP and bottoms pressure |
| 6 | Calculate average relative volatility of key components as the geometric mean of the relative volatilities at top and bottom temperature |
| 7 | Calculate minimum number of trays using desired separation and average relative volatility and the Fenske Equation (Dutta 2007) |
| 8 | Calculate minimum reflux ratio using Underwood Equation |
| 9 | Specify value of actual to minimum reflux ratio for the column and obtain actual number of trays from the Gilliland correlation and actual reflux ratio |
| 10 | Calculate top and bottom product flow rates using values fixed in Step 1,calculate column average temperature as geometric mean of top and bottom absolute temperatures |
| 11 | Calculate vapour and liquid rates in stripping and enriching section, calculate location of feed tray using Kirkbride equation |
| 12 | Evaluate liquid hold up, superficial gas and liquid velocities, evaluate pressure drop over the total column height, check for flooding |
| 13 | Refine value of reboiler pressure using value calculated in Step 12 |
| 14 | Go to step 5 and repeat the calculations till step 13 till pressure drop value in step 12 from two successive trials converge |
TABLE 2. Algorithm for preliminary short-cut calculations for the heavy water distillation column.
| Feed IP | Average relative volatility | Nmin | Rmin | Top temperature (K) | Bottom temperature (K) | ΔP/ΔPf | Theoreticalnumber oftrays |
|---|---|---|---|---|---|---|---|
| 90 | 1.049 | 302 | 17.91 | 328.45 | 333.7 | 0.0427 | 343 |
| 92 | 1.0492 | 301 | 18.43 | 328.45 | 331.1 | 0.0343 | 341 |
| 94 | 1.0494 | 299 | 19.03 | 328.45 | 332.45 | 0.0258 | 340 |
| 96 | 1.0496 | 298 | 19.78 | 328.45 | 331.8 | 0.0171 | 339 |
| 98 | 1.0498 | 297 | 20.93 | 328.45 | 331 | 0.0085 | 337 |
TABLE 3. Results of FUG calculations for the distillation column under typical operating conditions. (Top IP = 0.1%, Bottom IP = 99.95%, Top pressure = 120 mm Hg (a), Feed temperature = 330 K).
Dynamic Model of the Heavy Water Distillation Column
The model equations for the dynamic simulation are based on the following assumptions [18]:
a) Both the vapour and the liquid phases are taken as ideal solutions.
b) The top temperature was estimated from the given condensor operating pressure. The feed and the reflux are assumed to be at their dew point and bubble point respectively. The reflux condenser is assumed to be a total condenser.
c) The assumption of constant molal overflow is made, as a result of which the L / V ratio in rectifying section and L’/ V’ ratio in stripping section are taken as constant.
d) The stages are assumed to be 100% efficient and the liquid and the vapour streams leaving each tray are in equilibrium.
e) The pressure drop through the tower has been calculated based on the packing characteristics, which have been assumed to be equivalent to Sulzer™ CY type corrugated metal wire mesh packing. Based on the tower bottom pressure, temperature of the reboiler has been estimated. Knowledge of the top and bottom temperature enables calculation of a geometric average relative volatility that has been assumed to remain constant throughout the tower.
f) The tower has only the feed, distillate and the bottoms streams and no other side streams. Hence it is a simple column.
g) The liquid volume or hold up in the reboiler, reflux drum and on the hypothetical column plates are well-mixed regions having uniform composition, so no spatial variation of composition in the radial direction are envisaged. The liquid leaving each tray has been taken to have the same composition as that of the liquid on the tray.
h) The dynamics of the overhead pipe work and condenser are negligible, thus there are no time lag elements in the system. The dynamics of the vapour phase in the column are much faster than that of the liquid phase and are neglected.
i) The liquid hold-ups are constant on each tray and in the reboiler and reflux drums. Vapour hold ups are not considered in the model equations.
j) The exchange reactions between various isotopic water species on the trays have been neglected in studying the performance of the column. No active metal surfaces are assumed to be present in the tower to catalyze these reactions to any significant extent. All the three species have thus been considered independently, with no chemical reaction equilibrium affecting their distribution between vapour and liquid phases. This is only valid for heavy water purifying condition wherein feed of an already high D2O content is being considered.
k) The column has been considered to have no heat losses through the walls, hence enthalpy balances are not considered in this study, except for reflux condenser and reboiler heat duty calculations.
l) Owing to the rather low pressure drop calculated for the column operating conditions as specified in TABLE 1, a constant operating pressure has been assumed for the simulation studies.
Column model under total reflux conditions
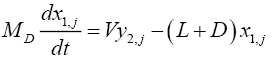
For column operation at total reflux condition, the above assumptions were used to write the following material balance equations [18]:
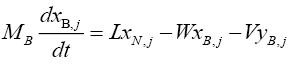
For the reboiler or sump (tray number N+1):
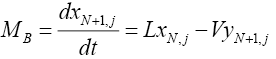 (4.1)
(4.1)
For the tray section (for tray number n where n varies from 2 to N):
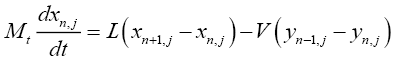 (4.2)
(4.2)
For the reflux drum (tray number 1):
 (4.3)
(4.3)
For operation under total reflux condition, V is equal to L. The vapour-liquid equilibrium relationship for the multicomponent system is expressed as:
 (4.4)
(4.4)
Equations 4.1 to 4.4 were written for each component on each tray and simultaneously integrated to obtain the time dependent composition profiles of each species on each tray. Calculations were continued till steady state compositions were attained on each tray. For total reflux operation, a given quantity of the feed was assumed to be fed to the sump. The initial feed composition as well as the initial composition of the liquid on each tray was specified. The numerical integration was carried out with the assumed initial composition profile. The values of the hold up in the sump and on each tray were taken as constants for a particular run. The vapour boil up rate can be varied by varying the heat input (steam flow rate or electrical heater power output) to the sump liquid and it is assumed that the required vapour flow rate is instantly established by neglecting heat transfer dynamics in the reboiler. The evolution of the composition profiles on each tray of the tower was then determined and the compositions at steady state were obtained.
Column model with continuous feed input and product withdrawal
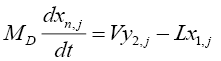
The model assumptions were used to write equations 4.5 to 4.11 for simulating the column behaviour under constant feed introduction and top and bottom product withdrawal [18]. The initial composition on each simulated tray of the column was assumed to be the composition attained from total reflux operation. The equations were then integrated as described in Section 4.1 to obtain the dynamic composition profiles along the column and arrive at the steady state compositions on each tray when the tower is operating continuously.
For the reflux drum (Tray 1):
 (4.5)
(4.5)
For trays in the rectification section:
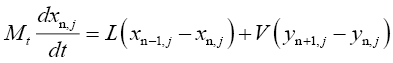 (4.6)
(4.6)
For the feed tray:
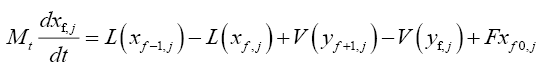 (4.7)
(4.7)
For trays in the stripping section:
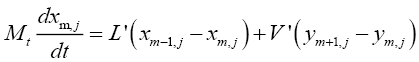 (4.8)
(4.8)
For the reboiler (tray N+2):
 (4.9)
(4.9)
Vapour liquid equilibrium relation:
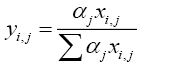 (5.0)
(5.0)
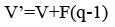
The relationship between the vapour and liquid flow rates in the enriching and stripping section to the feed quality can be expressed as follows (Treybal, 1981):

Results and Discussion
Some typical results of the tray to tray calculations for both total reflux and continuous column operation are presented in FIG. 4 and FIG. 5. Since the top and bottom products are of interest in the distillation column considered in this work, in all subsequent figures in this section, only the top tray and bottom tray liquid isotopic compositions are plotted. It is seen that composition pinch zones appear for D2O near the column bottom and at the top of the column for HDO and H2O.

FIG. 4: Liquid composition profiles in heavy water distillation column at total reflux condition (Initial feed composition: x(D2O) = 0.96, x(HDO) = 0.03, x(H2O) = 0.01, T = 333 K, V = 36 mol hr-1).

FIG. 5: Liquid composition profiles in heavy water distillation column under continuous operation (Initial feed composition: x(D2O) = 0.9604, x(HDO) = 0.0393, x(H2O) = 0.0003, T = 333 K, Reflux ratio = 570, Feed flow rate = 250 mol hr-1, Feed on tray # 245).
Parametric studies on total reflux condition operation
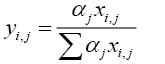
The top and bottom tray fluid compositions (i.e. isotopic purity) are of importance since in continuous operation, the two product streams will be withdrawn from these locations only. Based on the calculated composition profiles in terms of mole fractions of the three species, the isotopic purities are computed as in Equation (5.1) and represented in the subsequent figures.
 (5.1)
(5.1)
FIG. 6 demonstrates the effect of changing the vapour/liquid rate at total reflux by varying the heating rate of reboiler liquid on the top and bottom composition profiles. As the vapour rate changes, the liquid rate too changes and liquid superficial velocity changes. This causes a change in the liquid hold up on each tray and affects the time required to attain a steady composition profile. To illustrate the difference in the evolution of the composition profiles on changing the boil up rate, only the first 600 seconds of operation have been shown in this figure. The effect is seen to be more profound in the topmost tray (i.e. the reflux drum) profile.

FIG. 6: Effect of boil up rate on the isotopic purity of bottom and top tray liquid at total reflux (Initial feed composition: x(D2O) = 0.96, x(HDO) = 0.03, x(H2O) = 0.01, T = 333 K).
FIG. 7 illustrates the fact that increasing the average column operating temperature (which is directly dependent on the column operating pressure and the pressure drop) leads to a lowering of the steady state isotopic purity value of the reboiler liquid. This is due to the lower relative volatility at elevated temperature which leads to poor separation performance in the given distillation tower. It is also evident that the change in composition for every degree change in temperature is more pronounced for the reflux drum liquid as compared with the reboiler liquid.

FIG. 7: Effect of column average temperature on the isotopic purity of top and bottom tray liquid at total reflux (Initial feed composition: x(D2O) = 0.96, x(HDO) = 0.03, x(H2O) = 0.01, V = 750 mol hr-1).
Both FIG. 6 and 7 show that the steady state bottom isotopic purities are attained earlier than the steady top tray isotopic purity values i.e. there is a difference in the time constants of the mass and energy transfer processes in the top and bottom sections of the column due to the difference in composition of the fluids in the locations. In all the cases, the bottom liquid, which is the product of interest reaches the desired value of isotopic composition.
Parametric studies on continuous column operation
As with the operation under total reflux, parametric studies were carried out for the dynamic behaviour of the continuous column up to a time equal to first 60 hours of column operation. Results are presented in terms of isotopic purity of the liquid in the reflux drum and the reboiler in FIG. 8-12.

FIG. 8: Effect of column average temperature on the isotopic purity of top and bottom product (Feed composition: x(D2O) = 0.9604, x(HDO) = 0.0393, x(H2O) = 0.0003, R = 570, Feed tray # 245, F = 250 mol hr-1)

FIG. 9: Effect of reflux ratio on the isotopic purity of top and bottom product (Feed composition: x(D2O) = 0.9604, x(HDO) = 0.0393, x(H2O) = 0.0003, T = 333 K, Feed tray # 245, F = 250 mol hr-1).

FIG. 10: Effect of feed flow rate on the isotopic purity of top and bottom product (Feed composition: x(D2O) = 0.9604, x(HDO) = 0.0393, x(H2O) = 0.0003, R = 570, T = 333 K, Feed tray # 245).

FIG. 11: Effect of feed tray location on the isotopic purity of top and bottom product (Feed composition: x(D2O) = 0.9604, x(HDO) = 0.0393, x(H2O) = 0.0003, R = 570, T = 333 K, Feed flow rate = 250 mol hr-1).

FIG. 12: Effect of feed composition on the isotopic purity of top and bottom product (Feed tray # 245, R = 1000, T = 333 K, Feed flow rate = 250 mol hr-1).
FIG. 8 exhibits the same overall effect of temperature on the isotopic purity obtained in the top and bottom tray liquid. Increasing temperature lowers the purity and causes more deuterium to be lost through the top product. Increasing the reflux ratio improves the separation possible in the column. Changing reflux ratio implies change in the liquid rate through the column and thus this significantly affects the liquid hold up as well. Overall there is an improvement in the separation obtained in the column with increasing reflux ratio as indicated by FIG. 9. FIG. 10 shows that on increasing the feed flow rate through the column, it may initially appear that, product of higher isotopic purity is being obtained from the reboiler with a corresponding drop in purity of the top product. But on attainment of true steady state (about 300 hours of operation), the final product isotopic purities are seen to be independent of the feed flow rate. Higher feed flow rate implies higher liquid hold up and hence different time required for attainment of the true steady state.
Feed tray location seems to have little effect on the evolution of the composition profiles in case of this distillation operation, as indicated by FIG. 11. For feed having increasing isotopic purity (i.e. higher content of D2O ), the calculations and FIG. 12 show that there is very little difference in the final isotopic purity of the reboiler product achieved, yet the time taken to reach the steady state varies, with greater time being required for the more concentrated feed. Under off normal conditions, if feed of significantly low isotopic purity has to be purified in the same column to produce a bottoms product having the same purity requirements as the base case considered here, with the same reflux ratio being maintained, the feed flow rate i.e. the column throughput has to be proportionately reduced. For example, for feed having 20% IP, only 2.25 mol hr-1 of feed can be processed in the column, whereas for 50% IP, 17 mol hr-1 of feed can be handled. For feed of 80% IP, the value can increase to about 125 mol hr-1 while maintaining sufficient margin from flooding conditions as well as achieving desired separation.
For each of the cases considered for parametric analysis, the isotopic purity of the bottom liquid reaches the required specifications for reactor operation. But the top product too has a significantly high value of the deuterium content owing to the removal of most of the HDO in the feed through it. An indirect split of the three components has been assumed in this work, whereby D2O is recovered as a high purity product from the bottom of the column and it may be necessary to use another smaller distillation column in series with the first to further recover valuable deuterium from the top product. The other alternative would be to keep accumulating the top reject stream and then process it once or twice in the same column at a chosen flow rate. It must be kept in mind that this option will lower the availability factor of the column for its main duty.
Thermodynamic efficiency of heavy water distillation process
The second law efficiency of difficult distillation processes, such as the one considered in this work is known to be quite poor [15]. Using the steady state compositions and flow rates predicted by the simulations, some estimates of the value of the second law efficiency of the heavy water distillation process were obtained. These calculations require the knowledge of the feed and product stream enthalpies and entropies. Experimental data in the form of equations are available in literature expressing the values of these thermodynamic quantities for saturated liquid and vapour D2O and H2O as functions of temperature [19,20,21], but not for the species HDO. Thus for stream enthalpy and entropy calculations, only the two species D2O and H2O have been considered to be present in the feed. Stream property values have been calculated as the weighted average of the pure component properties at the appropriate stream temperatures. Results have been presented in TABLE 3 for some selected operating conditions of the column. The efficiency values are expectedly low, with an increase in the value being observed for higher column operating temperature and lowering of the value for a higher reflux ratio, keeping all other conditions unchanged. The condensor and reboiler heat duties range between 70 and 76 kW for the conditions specified in TABLE 4.
| Feed flow rate / Feed temperature / Stream condition | Distillate flow rate / Top temperature / Stream condition | Bottom product flow rate / Bottom Temperature / Stream condition | Overhead vapour flow rate / Overhead Temperature / Stream condition | Reflux ratio | Second law efficiency |
|---|---|---|---|---|---|
| 2200 mol hr-1/ 334 K/Saturated vapour |
mol hr-1/ 333 K/Saturated liquid |
mol hr-1/ 335 K/ Saturated liquid |
mol hr-1/333 K/Saturated vapour |
1.91% | |
| 2200 mol hr-1/ 354 K/Saturated vapour |
mol hr-1/ 353 K/Saturated liquid |
mol hr-1/ 355 K/ Saturated liquid |
mol hr-1/353 K/Saturatedvapour |
3.00% | |
| 2200 mol hr-1/ 334 K/Saturated vapour |
mol hr-1/ 333 K/Saturated liquid |
mol hr-1/ 335 K/ Saturated liquid |
mol hr-1/333 K/Saturatedvapour |
1.63% | |
| 2200 mol hr-1/ 354 K/Saturated vapour |
mol hr-1/ 353 K/Saturated liquid |
mol hr-1/ 355 K/ Saturated liquid |
mol hr-1/353 K/Saturatedvapour |
2.56% |
TABLE 4.Thermodynamic efficiency calculations for the purification column. (TRS = 389 K, TCW = 303 K).
Summary and Conclusion
The paper presents an unsteady state mathematical model for performance simulation of the distillation column for purifying the moderator and coolant heavy water of PHWRs with lower than desired isotopic purity for reactor oepration. Evaluation of some of the measures of column hydraulic behaviour has also been done and hydraulic behaviour of the column has been included in the simulation model along with the material balance and vapour liquid equilibrium equations. For the dynamic analysis of the column performance, liquid hold up is an important parameter, since its value appears in the dynamic material balance equations, unlike in the case of steady state simulations. Flooding and loading point calculations are pertinent for packed column simulation since these place practical limits on the maximum throughput that can be handled by a given column. For the typical column throughputs considered in this work, the prevailing vapour velocities are found to be much lower than the flooding velocities for the given liquid rates. Energy effects and chemical isotopic exchange have been ignored in this work and the vapour-liquid equilibrium data along with material balances have been used to predict the dynamic concentration profiles along the length of the column for both total reflux and continuous column operation. Effect of various operating parameters on the separation performance achievable in the column has been investigated. It is observed that increasing column temperature has an adverse effect on separation achieved but this may be countered by increasing the reflux ratio. Increasing feed flow rate affects the time required to attain the steady state but does not affect the final top and bottom product compositions achieved. Second law thermodynamic efficiency of the process is found to be around 1-3% for the typical operating conditions of the column. The model presented here may be further modified by inclusion of all the other isotopic water species in the material balance equations and equilibrium relationships. Further, consideration of the vapour hold ups and isotope exchange effect in the model equations will enable the dynamic model to become a truly general one for simulating or even designing water distillation columns through the method of repeated simulations.
Acknowledgements
The authors are thankful to Dr Sadhana Mohan, Heavy Water Division, BARC for encouragement and assistance rendered during the course of this work
References
- Hawes MG (1959) Preparation of Heavy Water by Catalytic Exchange. Platinum Metals Review 3: 118-124.
- Glasstone S, Sesonske A (2004) Nuclear Reactor Engineering, Volume 1, Reactor Design Basics, 4th ed. CBS Publishers and Distributors, New Delhi, India.
- Miller AI, Spagnolo DA, DeVore JR (1995) Choice of A Process Design for Simultaneous Detritiation and Upgrading of Heavy water for the Advanced Neutron Source. Nucl Tech 112: 204-213.
- Spagnolo DA, Miller AI (1995) The CECE Alternative for Upgrading/Detritiation in Heavy Water Nuclear Reactors and for Tritium Recovery in Fusion Reactors. Fus Sci Tech 28: 748-754.
- Ahn DH, Kim KR, Chung HS, Kim YE, Jeong IS, et al. (1990) Computer Program Development for D2O Upgrader Performance Management. J Korean Nucl Soc 22: 1-11.
- Kinoshita M (1984) Computer-Aided Simulation Procedure for Water Distillation Columns. J Nucl Sci Tech 21: 299-307.
- Sankar R, Ghosh B, Bhanja K (2013) Numerical analysis and optimisation of heavy water upgrading column. 66th Annual Session of Indian Institute of Chemical Engineers and joint Indo-North American symposium (CHEMCON 2013), Mumbai, India, 113-114.
- Magomedbekov EP, Belkin DY, Rastunova IL, Sazonov AB, Selivanenko IL, et al. (2017) Simulation and optimization of the deprotiation cascade of a heavy-water moderator. Theoretical Foundations of Chem Engg 51: 133-141.
- Magomedbekov EP, Belkin DY, Rastunova IL, Sazonov AB, Selivanenko IL, et al. (2017) Water distillation as a method of detritiation of heavy-water moderator. Theoretical Foundations of Chem Engg 51: 384-391.
- Van Hook WA (1968) Vapor Pressures of the Isotopic Waters and Ices. J Phys Chem 72: 1234-1244
- Matsunaga N, Nagashima A (1987) Saturation Vapor Pressure and Critical Constants of H2O, D2O, T2O and Their Isotopic Mixtures. Int J Thermophysics 8: 681-694.
- Kolev N (2006) Packed Bed Columns for Absorption, Desorption, Rectification and Direct Heat Transfer. Elsevier BV, Amsterdam, The Netherlands.
- Dutta BK (2007) Principles of Mass Transfer and Separation Processes. Prentice Hall of India Pvt. Ltd., New Delhi, India.
- Kestin J, Sengers JV, Kamgar-Parsi B, Levelt Sengers JMH, (1984) Thermophysical Properties of Fluid D2O. J Phys Chem Ref Data 13: 601-609.
- Seader JD, Henley EJ, Roper DK (2011) Separation Process Principles-Chemical and Biochemical Operations, 3rd ed. John Wiley & Sons, Inc., New Jersey, U.S.A.
- Stockfleth R, Brunner G (2001) Holdup, Pressure Drop, and Flooding in Packed Countercurrent Columns for the Gas Extraction. Ind Eng Chem Res 40: 347-356.
- Treybal RE (1981) Mass Transfer Operations, 3rd ed. McGraw Hill Book Company, Singapore.
- Ingham J, Dunn IJ, Heinzle E, Prenosil JE, Snape JB (2007) Chemical Engineering Dynamics, 3rd ed. Wiley-VCH Verlag GmbH & Co. KGaA, Weinheim, Federal Republic of Germany.
- Macmillan RDCh, Hill PG( 1990) Equations for the saturation properties of heavy water. In: Properties of Water and Steam. Proc. 11th International Conference, pp. 57-68, Ed.: Píchal M, Šifner O, Hemisphere Publishing Corporation, New York, U.S.A.
- Wagner W, Pruss A (1993) International Equations for the Saturation Properties of Ordinary Water Substance. Revised according to the International Temperature Scale of( 1990). J Phys Chem Ref Data22: 783-787
- Perry RH, Green DW ( 1999) Perry’s Chemical Engineers’ Handbook, 7th ed. The McGraw-Hill Companies, Inc., New York, U.S.A.