Original Article
, Volume: 15( 4)Structural and Spectroscopic Analysis of Indole-3-Carbinol by First Principle Calculations
- *Correspondence:
- Sinha L Department of Physics, University of Lucknow, Lucknow, India, Tel: 9415313779; E-mail: sinhaleena27@gmail.com
Received Date: June 02, 2017 Accepted Date: October 30, 2017 Published Date: November 02, 2017
Citation: Pathaka SK, Prasada O, Sinha L. Structural and Spectroscopic Analysis of Indole-3-Carbinol by First Principle Calculations. Int J Chem Sci. 2017;15(4):212.
Abstract
Present work aims at identifying the conformational, spectroscopic profile and non-linear optical properties of Indole-3-carbinol compound by means of experimental and computational methods. To achieve this vivid and holistic view of the structural profile of Indole-3-carbinol compound, a complete conformational search using 3D potential energy scan has been obtained by varying selected dihedral angles. To ascertain the existence of two conformers of Indole-3-carbinol theoretical IR and Raman spectra have been calculated at different functionals and basis sets and compared with experimental Fourier-transform infrared (FT-IR) and FT-Raman spectra. Precise normal coordinate analysis has been performed and detailed interpretations of the vibrational spectrum of the molecule have been made, based on the calculated potential energy distribution (PED). The molecular properties like Dipole moment, polarizability and first static hyperpolarizability have been computed. UV spectrum of the title compound has also been calculated and compared with the experimental spectra in different medium. A good agreement between theoretical and experimental values has been observed.
Keywords
Indole-3 carbinol; Potential energy surface; Non-linear optical behavior; Vibrational analysis
Introduction
Indole-3-carbinol (I3C) – a natural indolecarbinol, found in cruciferous vegetables of the family Brassicaceae (broccoli, cauliflower, bok choy, cabbage, garden cress, brussels sprouts etc.), is long been studied for its anticancer activities [1-10]. Recently Quirit et al. showed that I3C derivatives are effective inhibitors of NEDD4-1 ubiquitin ligase activity that disturb propagation of human melanoma cells [11]. Indole-3-carbinol is also reported as an inhibitor of glucocorticoid-induced apoptosis in osteoblastic cells by virtue of blocking ROS-mediated Nrf2 pathway [12]. Latosinska et al. [13] investigated structure–activity relationship of indole-3-carbinol and 3, 3’-diindolylmethane due to their structural differences using 1H–14N NQDR, 13C CP/MAS NMR and X-ray experimental techniques along with the theoretical density functional theory. They have reported that the either the crystal of I3C is composed of two conformers with unequal proportion or there is dynamic transformation between the two conformers. Ahna et al. [14] have investigated I3C in the gas phase using a laser desorption technique and came out with the presence of only one conformer of I3C in the mass-selected resonant two-photon ionization spectrum through UV-UV hole-burning technique. They calculated the anharmonic vibrational wave-numbers after declaring the harmonic wavenumbers of two conformers almost exactly identical. Theoretical calculation of anharmonic wave-numbers provided an explicit assignment of the experimental spectrum of I3C to the global minimum conformer of it. Ahna et al. have admitted that the moderate level of theory (6-31+G (d)) used for the anharmonic calculations can be challengeable. In spite of these theoretical studies, we feel more rigorous theoretical analysis is required for I3C; in particular effect of functionals and basis sets on vibrational wavenumbers should be investigated to have a deeper insight of the spectroscopic profile and molecular properties.
To have a vivid and holistic view of the structural profile of the compound, a complete conformational search using 3D potential energy scan has been obtained by varying selected dihedral angles. The Fourier-transform infrared (FT-IR) spectrum of the title compound have been recorded to make an explicit assignment of the experimental spectra. Precise normal coordinate analysis has been performed and detailed interpretations of the vibrational spectra (FT-IR and FT-Raman) of the molecule have been made, based on the calculated potential energy distribution (PED). The molecular properties like dipole moment, polarizability and first static hyperpolarizability have been computed. UV spectrum of the title compound has also been calculated and compared with the experimental spectra in different medium. The energies and oscillator strengths calculated by time-dependent density functional theory (TD-DFT) results complement with the experimental findings. To study the stability of the molecule arising from charge delocalization Natural bond orbital (NBO) analysis has been performed.
Experimental and Computational Details
Sample and instrumentation
The title compound indole-3 carbinol (henceforth abbreviated as I3C) was purchased from Sigma-Aldrich chemical Co., USA with a stated purity of greater than 99% and has been used as such without further purification for spectroscopic measurements. The FT-IR spectrum of title compound was recorded using Perkin Elmer version 10.03.06 series spectrometer in the region 4000 cm-1 to 400 cm-1 with a spectral resolution of 4.0 cm-1, using KBr pellet method. UV absorption spectrum was recorded in 10-5 M solution of I3C in methanol and water solvent, on JASCO-UV (V-670) UV-VIS spectrometer, in the spectral region of 200 nm-500 nm. Both FT-IR and UV-VIS spectra were recorded at IIT Kanpur. The FT-Raman spectrum in the region 3000 cm-1-200 cm-1 with a spectral resolution of 0.5 cm-1 was recorded on a Varian 7000 series spectrometer using 1064 nm laser line at AIRF, Jawaharlal Nehru University, New Delhi, India.
Computational details
Molecular structure, electronic, non-linear and vibrational properties of indole derivatives have been recently investigated by Shukla et al. and Srivastava et al. [15,16]. In order to provide a comprehensive information pertaining to the structural features of I3C, the gradient-corrected DFT [17] using pure hybrid B3LYP [18,19] with polarised triple zeta 6-311++G (d, p) basis set has been employed. To investigate the effect of different functionals on spectroscopic profile of the title compound we have employed B3LYP, CAM-B3LYP [20] and M06-2X [21] functionals. Effect of basis sets if any, has been inspected at B3LYP with 6-31+G (d, p), 6-311++G (d, p) and cc-pVTZ basis sets. All calculations in this study have been performed with the Gaussian 09 program package [22] and results were analyzed with the Gauss view 5.0 molecular visualization program [23]. The most popular B3LYP (Beck 3 exchange and Lee-Yang-Parr correlation functional) functional used in the study mixes a certain amount of the exact Hartree-Fock exchange energy into the exchange and correlation obtained from other functional. The meta-hybrid M06-2X functional has decent response under dispersion forces and hence regarded as one of the best functional to analyze the non-covalent interactions [21]. The CAM-B3LYP functional presented by Tawada et al. [20] integrates the long-range correction.
To investigate the most stable conformer of title molecule, 3D potential energy scan (PES) was performed by varying the C8-C16-O19-H20 and C7-C8-C16-O19 dihedral angles at B3LYP/6-311+G (d, p) level of theory. The obtained PES, showing the variation of energies with corresponding dihedral angles is given in Figure 1 and the five stable conformers of the title molecule corresponding to minima’s on PES are given in Table 1.

Figure 1: 3-Dimensional potential energy scan (PES) of I3C molecule, scanned about dihedral angles C8-C16-O19-H20 and C7-C8-C16-O19 at DFT-B3LYP/6-311+G (d, p) level of theory.
| Conformers | Dihedrals | Energy | |
|---|---|---|---|
| C7-C8-C16-O19 | C8-C16-O19-H20 | (Hartree) | |
| a | 120 | 50 | -478.48038027 |
| b | 110 | 180 | -478.47773254 |
| c | 90 | 50 | -478.47923830 |
| d | 30 | 60 | -478.47871632 |
| e | 0 | 180 | -478.47766251 |
Table 1. Energies of stable conformers of I3C molecule obtained by PES about dihedrals C8-C16-O19-H20 and C7-C8-C16-O19 by relaxing all other parameters, using DFT/6-311+G (d, p) method.
Two most stable conformers (a) and (c) (henceforth abbreviated as conf. 1 and conf. 2) having the energy difference of 0.717 Kcal/mol were further optimized at higher basis set 6-311++G (d, p) and the obtained ground state structures of both conformers of I3C are shown in Figure 2. Both the conformers have been investigated for the calculation and comparison of various quantum chemical and spectroscopic properties. Positive value of all the calculated vibrational wavenumbers of both conformers confirms the stability of their optimized geometries. An empirical uniform scaling factor of 0.983 up to 1700 cm-1 and 0.958 for greater than 1700 cm-1 [24,25] were used to outweigh the systematic errors caused by basis set incompleteness, neglect of electron correlation and vibrational anharmonicity. The simulated IR spectrums of both isomers have been compared with the experimental FT-IR of I3C compound.

Figure 2: Two most stable conformers of I3C molecule.
Vibrational assignments using percentage potential energy distribution (PED) have been done with the MOLVIB program (version V7.0-G77) written by Sundius [26-28]. The theoretical IR and Raman spectra have been simulated using the pure Lorentzian band shape with FWHM of 10 cm-1.
The electronic absorption spectrum involves calculation of the allowed excitations and oscillator strengths. Theoretical UVVis spectrum have been computed by TD-DFT method with 6-311++G (d, p) basis set for gas phase and solvent effect has also been taken into consideration by implementing IEFPCM model at the same level of theory. The electronic properties such as HOMO and LUMO energies were also determined by TD-DFT approach. To investigate the reactive sites of the compound, the molecular electrostatic potential surface (MESP) has been drawn at DFT level.
Optimized structure of both conformers has also been used to calculate the dipole moment, mean polarizability and first static hyperpolarizability, based on the finite field approach using B3LYP. The dipole moment (µ), mean polarizability (αmean) and first static hyperpolarizability (β) have been calculated following Buckingham’s definitions [28,29],

Where, 
The α and βtot values of Gaussian output are in atomic units (a.u.) and therefore are converted into electrostatic units (esu) (α; 1 a.u.=0.1482 × 10⁻²⁴ esu, β; 1 a.u.=8.6393 × 10⁻³³ esu). To investigate the solvent effect on dipole moment of I3C, TD-DFT approach was used by implementing IEFPCM model at B3LYP/6-311++G (d, p) level.
To understand various second order interactions between the filled orbitals of one subsystem and vacant orbitals of another subsystem, we analyzed the Natural bond orbitals (NBO) [30], which quantify the intramolecular delocalization or hyperconjugation. To have a good insight of the donor-acceptor interactions the second order perturbation theory analysis of Fock matrix in NBO basis of I3C has been carried out. The interaction is a consequence of loss of electron occupancy from the localized NBO of the idealized Lewis structure into an empty non-Lewis orbital. For each donor (i) and acceptor (j), the stabilization energy associated with the delocalization i→j is estimated as:
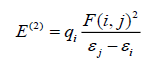
Where, qi is the donor orbital occupancy, are diagonal elements and F (i, j) is the off diagonal NBO Fock matrix element. These calculations allow us to analyse the probable charge-transfers and the intra-molecular bond paths. In addition, the variations in the thermodynamic functions such as heat capacity, entropy and enthalpy with temperature have also been calculated.
Results and Discussion
Molecular geometry and PES scan
The requisites of getting all possible conformers for any molecule is to perform potential energy surface (PES) scan. The conformational flexibility of the title compound depends on dihedral angles C7-C8-C16-O19 and C8-C16-O19-H20, therefore to calculate the stable conformers of the molecule, PES scan were performed at DFT/B3LYP/6-311++G (d, p) level of theory by varying aforesaid dihedral angles in steps of 10° from -180° to 180° and all the geometrical parameters were simultaneously relaxed during the scan, excluding the two selected dihedral angles. The torsional profile of PES scan shown in Figure 1, reveals 5 stable conformers (Table 1) corresponding to minima on PES. Eigen values obtained from scan output divulges that, I3C (a) (conf. 1) and I3C (c) (conf. 2), positioning the dihedral C7-C8-C16-O19/C8-C16-O19-H20 at 120°/50° and 90°/50° respectively having very minor energy difference of 0.717 kcal/mol are the two most stable conformers (Table 1). As the energy difference for the two conformers is very small (less than 1 kcal/mol), one can expect significant Boltzmann population for conf. 2 at the room temperature [13,14]. Therefore, both conformers were further optimized at the higher level B3LYP/6-311++G (d, p), relaxing all parameters. The ground state energy difference of the conformers further reduces at higher basis set. The optimized geometrical parameters of the two conformers of I3C are given in Table 2 and shown as bar chart in Figure 3 for comparative view. The obtained optimized parameters were compared with the experimental X-ray data [13].

Figure 3: Bar chart showing the comparative view of the optimized geometrical parameters of both conformers of I3C calculated at DFT-B3LYP/6-311++G (d, p) level.
| Bond length |
Calc. value | Exp. value(*) | Bond angle | Calc. value | Exp. value(*) |
Dihedral angle | Calc. value | Exp.(*) | |||||||
|---|---|---|---|---|---|---|---|---|---|---|---|---|---|---|---|
| Conf.1 | Conf.2 | Conf.1 | Conf.2 | Conf.1 | Conf.2 | ||||||||||
| C1-C2 | 1.419 | 1.420 | 1.408 | C5-C4-H10 | 119.19 | 119.22 | - | C2-C1-N15-H13 | 179.52 | 178.59 | |||||
| C1-C6 | 1.397 | 1.397 | 1.387 | C4-C5-C6 | 121.23 | 121.17 | 121.66 | C6-C1-N15-C7 | 179.82 | 179.55 | |||||
| C1-N15 | 1.382 | 1.381 | 1.371 | C4-C5-H11 | 119.41 | 119.41 | - | C6-C1-N15-H13 | 0.32 | 1.06 | |||||
| C2-C3 | 1.404 | 1.405 | 1.401 | C6-C5-H11 | 119.37 | 119.42 | - | C8-C2-C3-H9 | 1.17 | 0.18 | - | ||||
| C2-C8 | 1.444 | 1.445 | 1.431 | C1-C6-C5 | 117.43 | 117.52 | 117.67 | C1-C2-C8-C7 | 0.25 | 0.03 | 1.52 | ||||
| C3-C4 | 1.387 | 1.387 | 1.374 | C1-C6-H12 | 121.50 | 121.45 | - | C1-C2-C8-C16 | 179.32 | 177.38 | 179.39 | ||||
| C3-H9 | 1.084 | 1.085 | 0.945 | C5-C6-H12 | 121.07 | 121.03 | - | C3-C2-C8-C7 | 179.78 | 179.51 | 179.29 | ||||
| C4-C5 | 1.409 | 1.409 | 1.392 | C8-C7-H14 | 129.40 | 129.35 | - | C3-C2-C8-C16 | 0.64 | 3.14 | 0.21 | ||||
| C4-H10 | 1.084 | 1.084 | 1.007 | C8-C7-N15 | 109.99 | 110.01 | - | C2-C3-C4-C5 | 0.34 | 0.06 | 1.17 | ||||
| C5-C6 | 1.388 | 1.388 | 1.364 | H14-C7-N15 | 120.61 | 120.64 | - | C2-C3-C4-H10 | 179.98 | 179.94 | - | ||||
| C5-H11 | 1.084 | 1.084 | 1.012 | C2-C8-C7 | 106.45 | 106.38 | 106.04 | H9-C3-C4-C5 | 178.98 | 179.67 | - | ||||
| C6-H12 | 1.085 | 1.085 | 0.945 | C2-C8-C16 | 127.42 | 126.93 | 126.96 | H9-C3-C4-H10 | 0.71 | 0.21 | - | ||||
| C7-C8 | 1.372 | 1.372 | 1.362 | C7-C8-C16 | 126.13 | 126.62 | 126.99 | C3-C4-C5-C6 | 0.04 | 0.09 | 0.64 | ||||
| C7-H14 | 1.08 | 1.079 | 1.040 | C1-N15-C7 | 109.19 | 109.31 | 108.97 | C3-C4-C5-H11 | 179.83 | 179.97 | - | ||||
| C7-N15 | 1.381 | 1.380 | 1.359 | C1-N15-H13 | 125.55 | 125.48 | - | H10-C4-C5-C6 | 179.73 | 179.79 | - | ||||
| C8-C16 | 1.495 | 1.495 | 1.470 | C7-N15-H13 | 125.25 | 125.19 | - | H10-C4-C5-H11 | 0.14 | 0.10 | - | ||||
| H13-N15 | 1.006 | 1.006 | 0.901 | C8-C16-H17 | 111.07 | 110.01 | - | C4-C5-C6-C1 | 0.13 | 0.18 | 0.29 | ||||
| C16-H17 | 1.093 | 1.098 | 1.036 | C8-C16-H18 | 109.56 | 110.66 | - | C4-C5-C6-H12 | 179.88 | 179.82 | - | ||||
| C16-H18 | 1.098 | 1.091 | - | C8-C16-O19 | 113.57 | 113.84 | 119.39 | H11-C5-C6-C1 | 180.00 | 179.94 | - | ||||
| C16-O19 | 1.436 | 1.439 | 1.337 | H17-C16-H18 | 107.39 | 107.46 | - | H11-C5-C6-H12 | 0.01 | 0.06 | - | ||||
| O19-H20 | 0.963 | 0.963 | 0.071 | H17-C16-O19 | 104.57 | 109.58 | - | H14-C7-C8-C2 | 179.49 | 179.73 | - | ||||
| Bond angle | H18-C16-O19 | 110.43 | 105.01 | - | H14-C7-C8-C16 | 0.09 | 2.37 | - | |||||||
| C2-C1-C6 | 122.31 | 122.37 | 122.23 | C16-O19-H20 | 107.86 | 108.08 | - | N15-C7-C8-C2 | 0.24 | 0.03 | 1.07 | ||||
| C2-C1-N15 | 107.22 | 107.11 | 107.28 | Dihedral | N15-C7-C8-C16 | 179.34 | 179.84 | ||||||||
| C6-C1-N15 | 130.47 | 130.52 | 130.49 | C6-C1-C2-C3 | 0.28 | 0.03 | C8-C7-N15-C1 | 0.14 | 0.20 | ||||||
| C1-C2-C3 | 118.96 | 118.72 | 118.38 | C6-C1-C2-C8 | 179.69 | 179.60 | C8-C7-N15-H13 | 179.36 | 178.57 | - | |||||
| C1-C2-C8 | 107.15 | 107.19 | 107.10 | N15-C1-C2-C3 | 179.86 | 179.65 | H14-C7-N15-C1 | 179.47 | 179.81 | - | |||||
| C3-C2-C8 | 133.89 | 134.08 | 134.51 | N15-C1-C2-C8 | 0.17 | 0.08 | H14-C7-N15-H13 | 0.03 | 1.70 | - | |||||
| C2-C3-C4 | 118.92 | 119.11 | 119.13 | C2-C1-C6-C5 | 0.01 | 0.12 | C2-C8-C16-O19 | 62.70 | 85.25 | 60.78/83.21 | |||||
| C2-C3-H9 | 120.33 | 120.69 | - | C2-C1-C6-H12 | 180.00 | 179.88 | C7-C8-C16-O19 | 117.80 | 91.57 | 97.88 | |||||
| C4-C3-H9 | 120.75 | 120.21 | - | N15-C1-C6-C5 | 179.82 | 179.72 | C8-C16-O19-H20 | 48.08 | 46.45 | - | |||||
| C3-C4-C5 | 121.15 | 121.11 | 120.91 | N15-C1-C6-H12 | 0.17 | 0.28 | |||||||||
| C3-C4-H10 | 119.66 | 119.67 | - | C2-C1-N15-C7 | 0.03 | 0.10 | |||||||||
(*) J. N. Latosi?ska, M. Latosi?ska, M. Szafra?ski, J. Seliger, V. ?agar, D. V. Burchardt, CCDC 1039027: Experimental Crystal Structure Determination (2015).
Table 2. The optimized geometric parameters of I3C computed at B3LYP/6-311++G (d, p) level.
The computed average C-C bond lengths of six-member ring in both conformers is 1.40 Å, well matched with experimental average value 1.39 Å. Computed as well as experimental value of C7-C8 bond of hetero ring is shorter in comparison to all other C-C bonds of the same ring indicating its double bond nature. Bond lengths C1-N15 and C7-N15 are almost equal having same values in both conformers. No significant change is observed in respective bond lengths of both conformers. Due to different orientation of ‘O’ atom with respect to ring skeleton the HCO bonds show slightly different values in the two conformers while no remarkable change occurred in other bond angles of both conformers. The optimized values of C2-C8- C16-O19/C7-C8-C16-O19 dihedrals in conf. 1 and conf. 2 are computed to be 62.70°/85.25°and 117.80°/91.57° respectively. All the dihedral angles associated with fused ring are approximately either 0° are 180°, in good agreement with experimental values.
Electronic properties and UV-Vis studies
The highest occupied molecular orbital (HOMO), lowest unoccupied molecular orbital (LUMO) of a molecule are referred as frontier orbitals and the gap in energy between these two molecular orbitals is an important stability parameter. These orbitals determine the way the molecule interacts with other species. The HOMO-LUMO gap can be related with the chemical reactivity and kinetic stability of a molecule. Smaller the gap more polarisable is the molecule with a high chemical reactivity, low kinetic stability [31,25].
Fully optimized ground-state structure of both conformer of title molecule have been used at TD-DFT/B3LYP/6-311++G (d, p) level, to analyse the frontier molecular orbitals such as HOMO, LUMO and other molecular orbitals involved in electric transition, by computing their energies (Table 3) in gas phase as well as in water and methanol solvent. The frontier orbital gap, ΔE(LUMO)~(HOMO) (Table 3), of conformer 2 in gas phase is found to be 5.10871 eV while that of conf. 1 is predicted to be 5.16422 eV. The plots of frontier molecular orbitals (Figure 4) of both conformers in methanol solvent shows that HOMO of the title molecule spreads over the entire molecule showing π bonding nature, while the LUMO is distributed over indole ring only and shows π anti-bonding nature.

Figure 4: Frontier molecular orbitals of both conformers of I3C in methanol solvent calculated using TD-DFT 6-311++G (d, p) level.
| Parameters | Conformer 1 | Conformer 2 | ||||
|---|---|---|---|---|---|---|
| Gas | Methanol | Water | Gas | Methanol | Water | |
| Etotal (eV) | -13020.21692 | -13020.51837 | -13020.52865 | -13020.18580 | -13020.49547 | -13020.50564 |
| ELUMO+1 | -0.46151 | -0.23783 | 0.23919 | -0.43321 | -0.23348 | -0.23429 |
| ELUMO | -0.74968 | -0.82070 | -0.82478 | -0.83812 | -0.84900 | -0.85145 |
| EHOMO | -5.91390 | -5.96723 | -5.97023 | -5.94682 | -5.97322 | -5.97621 |
| EHOMO-1 | -6.36724 | -6.45649 | -6.46112 | -6.44616 | -6.47718 | -6.48044 |
| ΔE(LUMO)~(HOMO) | 5.16422 | 5.14653 | 5.14544 | 5.10871 | 5.12422 | 5.12476 |
| ΔE(LUMO)~(HOMO-1) | 5.61756 | 5.63579 | 5.63634 | 5.60804 | 5.62818 | 5.62899 |
| ΔE(LUMO+1)~(HOMO) | 5.45239 | 5.72940 | 6.20942 | 5.51361 | 5.73974 | 5.74192 |
| µx | -0.7544 | -0.7457 | -0.7437 | -1.8383 | -2.1003 | -2.1077 |
| µy | 3.6852 | 5.0440 | 5.0953 | 2.3393 | 3.0744 | 3.0965 |
| µz | 0.2891 | 0.3848 | 0.3896 | 0.3399 | 0.4061 | -0.4078 |
| µtot | 3.7727 | 5.1133 | 5.1640 | 2.9945 | 3.7454 | 3.7679 |
Table 3. Calculated ground state energy (eV), frontier molecular orbitals energies (eV) and dipole moments (Debye) of I3C in gas and solution phase.
In order to understand electronic transitions of compound, time-dependent DFT (TD-DFT) calculations on optimized structure of both conformers were performed in gas phase and solvent (methanol and water). The calculation of absorption wavelengths (λ), oscillator strengths (f) and vertical excitation energies (E) for gaseous and solution phase (methanol and water) were carried out and compared with experimental values (Table 4).
| Experimental | Conf. 1 | Conf. 2 | |||||||
|---|---|---|---|---|---|---|---|---|---|
| λ (nm) | E (eV) | Abs. | λ (nm) | E (eV) | f | λ (nm) | E (eV) | f | |
| Methanol | |||||||||
| 278 | 4.4599 | 0.21 | 269.66 (H→L) | 4.5979 | 0.0860 | 270.10 (H→L) | 4.5903 | 0.0899 | |
| 256.32 (H-1→L) | 4.8371 | 0.0318 | 256.62(H-1→L) | 4.8314 | 0.0391 | ||||
| 246.74 (H→L+1) | 5.0248 | 0.0426 | 246.63(H→L+1) | 5.0272 | 0.018 | ||||
| 224 | 5.5350 | 0.98 | 230.73 (H→L+2) | 5.3735 | 0.0679 | 231.58(H→L+2) | 5.3537 | 0.0206 | |
| 226.99 (H→L+4) | 5.4620 | 0.0047 | 225.96 (H→L+4) | 5.4870 | 0.0065 | ||||
| 224.47 (H-1→L+1) | 5.5235 | 0.0066 | 223.93(H-1→L+1) | 5.5366 | 0.0082 | ||||
| Water | |||||||||
| 276 | 4.4922 | 0.57 | 269.81 (H→L) | 4.5952 | 0.0860 | 270.12(H→L) | 4.5899 | 0.0900 | |
| 256.33 (H-1→L) | 4.8370 | 0.0313 | 256.59(H-1→L) | 4.8320 | 0.0391 | ||||
| 246.64 (H→L+1) | 5.0269 | 0.0438 | 246.53 (H→L+1) | 5.0291 | 0.0186 | ||||
| 226 | 5.4860 | 0.98 | 230.38 (H→L+2) | 5.3816 | 0.0694 | 231.15(H→L+2) | 5.3637 | 0.0218 | |
| 226.74 (H→L+4) | 5.4682 | 0.0046 | 225.77(H→L+4) | 5.4916 | 0.0063 | ||||
| 224.33 (H-1→L+1) | 5.5269 | 0.0064 | 223.82(H-1→L+1) | 5.5395 | 0.0081 | ||||
| Gas Phase | |||||||||
| 265.21 (H→L) | 4.6750 | 0.0648 | 268.22(H→L) | 4.6224 | 0.0695 | ||||
| 262.45 (L→L+1) | 4.7241 | 0.0040 | 259.20(H→L+1) | 4.7834 | 0.0017 | ||||
| 255.54 (H-1→L) | 4.8518 | 0.0358 | 257.03 (H-1→L) | 4.8237 | 0.0280 | ||||
| 239.60 (H→L+2) | 5.1747 | 0.0418 | 241.87(H→L+2) | 5.1260 | 0.0107 | ||||
| 238.45 (H-1→L+1) | 5.1997 | 0.0090 | 234.55(H-1→L+1) | 5.2860 | 0.0027 | ||||
| 233.79 (H→L+3) | 5.3032 | 0.0004 | 230.94(H→L+3) | 5.3686 | 0.0038 | ||||
Table 4: The calculated and experimental absorption wavelengths (λ, nm), excitation energies (E, eV), and absorbance values or oscillator strengths (f) of investigated compound in water, and methanol solvent computed at TD-DFT/B3LYP/6-311++G(d,p) level.
The simulated UV spectrum of Conf. 1/Conf. 2 consist of absorption peaks at 265.21/268.22 nm in gas phase with slight red shift in polar solvents namely methanol and water (269.66/270.10 nm and 269.81/270.12 nm). This electronic absorption corresponds to the transition from the HOMO (39) to the LUMO (40) excited state and is in good agreement with the intense electronic transition in experimental UV spectrum of title compound at 278 nm/276 nm in methanol/water solvent. Another intense absorption band at 224/226 nm in experimental spectrum of I3C in methanol/water solvent, with computed values 230.73/231.58 and 230.38/231.15 nm in Conf. 1 and Conf. 2. This electronic absorption is associated with the transition from HOMO→LUMO+2 in both the conformers. The experimental UV spectrum of title compound along with simulated that for both conformers in methanol and water solvents is shown in Figure 5. Simulated UV spectra of both the conformers are nearly identical with peaks corresponding to the similar transitions in both the conformers except Conf. 1 having higher oscillator strength for the equivalent transition. Our theoretical UV analysis is in line with the studies of Latosinska et al. [13] that the crystal of I3C is composed of two conformers with unequal proportion (70% and 30%).

Figure 5: Comparison of simulated UV absorption spectra of both conformers with experimental UV spectrum.
Molecular electrostatic potential map (MESP) (electrostatic potential plotted on top of an electron iso-density surface) may be used to predict binding sites for electrophilic attack (electron rich region) and nucleophilic attack (electron poor region). Even when the two molecules are structurally alike, the MESP map make clear that this similarity does not carry over into their electrophilic or nucleophilic reactivates. The MESP surface simultaneously displays molecular size, shape and electrostatic potential in terms of colour coding and is a practical tool in the investigation of correlation between molecular structure and the physiochemical property relationship of molecules including bio molecules and drugs [32-37]. The red and blue region refers to the electron rich and electron poor region while green region in the MESP suggests almost the neutral potential. Binding of a drug to its receptor site confide in the variation in electrostatic potential produced by a molecule, with binding site in general having opposite areas of electrostatic potential. The MESP map of conformer. 1 of I3C (Figure 6) clearly suggests that the electron rich (red) region is spread around carbon atoms of hexa-ring of indole moiety as well as oxygen atom of carbinol group whereas regions around the hydrogen atoms are electropositive region, so are the preferred binding sites for electro phobic attack (blue). The MESP map of conf. 2 also predict same electrophilic or nucleophilic reactive sites.

Figure 6: MEP Surface for both conformers of I3C calculated at B3LYP/6-311++G (d, p).
Non-linear optical properties
To predict the nonlinear optical activity of the title compound, components of various electric moments such as dipole moment (μ), polarizability (α) and first order static hyperpolarizability (β) of both conformers, have been calculated using DFT/B3LYP/6-311++G (d, p) method. The dipole moment of the molecule is also computed and solvent effect has been taken into consideration by implementing IEF-PCM model. Calculation of polarizability and first hyperpolarizability (β) is based on finite-field approach. First hyperpolarizability is a third rank tensor that can be described by a 3 × 3 × 3 matrix. All the 27 components of the matrix can be reduced to 10 components due to the Kleinman symmetry [37,38]. Total electric dipole moment (μ), mean polarizability <α> and total first order static hyperpolarizability (βtotal) have been calculated using the x, y and z components of these parameters and are presented in Table 5.
| Dipole moments | Hyperpolarizability | ||||
|---|---|---|---|---|---|
| Conf.1 | Conf.2 | Conf.1 | Conf.2 | ||
| μx | -0.7544 | -1.8383 | βxxx | 84.1050 | 26.7678 |
| μy | 3.6852 | 2.3393 | βxxy | -85.4094 | -103.1269 |
| μz | 0.2891 | 0.3399 | βxyy | 9.6628 | -6.1281 |
| μtot | 3.7727 | 2.99450 | βyyy | 12.8686 | -27.6025 |
| Polarizability | βxxz | 7.4824 | bxxz | ||
| αxx | 148.8310 | 149.597 | βxyz | 2.8041 | -1.3228 |
| αxy | 10.2970 | 10.103 | βyyz | -29.9435 | 14.9638 |
| αyy | 130.3650 | 128.649 | βxzz | 9.8330 | 34.8579 |
| αxz | -4.2850 | -5.876 | βyzz | -13.7914 | -27.3206 |
| αyz | 2.9320 | 2.627 | βzzz | 7.4638 | 34.5644 |
| αzz | 71.8800 | 71.774 | βtot | 135.6882 | 180.5674 |
| αmean | 117.025 | 116.673 | βtot(esu) | 1.1723x10⁻³⁰ | 1.5600 x10⁻³⁰ |
| αmean(esu) | 17.343 × 10⁻²⁴ | 17.291 × 10⁻²⁴ | - | - | - |
Table 5. Electric dipole moment, polarizability and first order static hyperpolarizability data for I3C, calculated at B3LYP/6-311++G (d, p).
The total dipole moment of the Conf. 1/Conf.2 is calculated to be 3.7727/2.9945 Debye. These values change significantly in polar solvents methanol (5.1133/3.7454 Debye) and water (5.1640/3.7679 Debye) (Table 4). The predicted value of mean polarizability (αmean) of title compound are found to be 17.3432 × 10⁻²⁴ esu and 17.2910 × 10⁻²⁴ esu respectively for the two conformers. The large value of total first order static hyperpolarizability (βtotal) indicates that the title compound possesses considerable non-linear optical properties.
Vibrational analysis
The title molecule consists of 20 atoms with no special symmetry, hence all the (3n-6) 54 normal modes of vibrations of the molecule are both IR-and Raman-active and are spread over the functional and fingerprint regions. To simulate the spectra, the calculated Raman and IR spectral intensities were used to convolute all the predicted vibrational modes by means of a pure Lorentzian line shape with a FWHM bandwidth of 10 cm-1. To ascertain the existence of a single or both the conformers of the title compound we have thoroughly investigated the effect of different functionals as well as basis set on the simulated spectra. For this we have computed IR as well as Raman spectra at B3LYP, CAM-B3LYP and M06-2X functionals. Effect of basis sets on spectra have been examined using B3LYP functional with 6-31++G (d, p), 6-311++G (d, p) and cc-pVTZ basis sets. IR spectra of both the conformers were first calculated at different basis sets and it is evident from Figure 7 that spectra of Conf. 1 are alike irrespective of the basis set and same is true for Conf. 2 also. Plot of IR and Raman spectra (Figure 8 and Figure 9) of the two conformers at different functionals suggests that the spectra do change with the functionals.

Figure 7: IR spectra of both the conformers of I3C calculated at different basis sets.

Figure 8: Simulated IR spectra of the both conformers calculated using different functionals.

Figure 9: Simulated Raman spectra of the both conformers calculated using different functionals.
Further we have calculated the combined spectra of the Conf. 1 and Conf. 2 with 70% and 30% contribution respectively. A close examination of Figure 8 showed that major difference in the spectra of two conformers is in the range 1200 cm-1-700 cm-1 which led us to plot the simulated combined spectrum at B3LYP/6-311++G (d, p) with the experimental FT-IR Spectrum (Figure 10). Due to the reasonable agreement between the two spectra (simulated and experimental), theoretical vibrational analysis was performed for Conf. 1 at the B3LYP level with 6-311++G (d, p) basis set. For detailed vibrational description of title molecule normal coordinate analysis has also been performed using MOLVIB program. For this purpose, the full set of non-redundant internal coordinates have been defined (Table S1 supplementary material) and using these a set of 54 local symmetry coordinates for I3C were defined as recommended by Fogarasi and Pulay [38-40] presented in Table S2 (supplementary material). The method is useful for determining the mixing of other modes, but maximum contribution is accepted to be the most significant mode. Specific assignment to each vibration is attempted through potential energy distribution (PED). Observed FT-IR and FT-Raman bands (Figure 11) and calculated IR and Raman intensities, scaled wave numbers along with their assignment are given in Table 6.

Figure 10: Simulated combined spectrum at B3LYP/6-311++G (d, p) with the experimental FT-IR spectrum in the range 700 cm-1-1200 cm-1.

Figure 11: Experimental FT-IR and FT-Raman spectrum of I3C.
| Calc. wave numbers in cm-1 | Experimental wave number | Computed IR/Raman int. | Assignment of dominant modes in order of decreasing potential energy distribution (PED) | |||||||
|---|---|---|---|---|---|---|---|---|---|---|
| Unscaled | Scaled | Conf.1 | Conf.2 | |||||||
| Conf.1 | Conf.2 | Conf.1 | Conf.2 | FTIR in cm-1 |
Raman in cm-1 | IIRa | IRaa | IIRa | IRaa | |
| 3823 | 3830 | 3662 | 3669 | 3473 | 21.5 | 2.07 | 20.4 | 1.35 | ν(O-H)(100) | |
| 3673 | 3670 | 3519 | 3516 | 3370 | 77.9 | 4.69 | 78.9 | 4.72 | ν(N-H)(R2)(99) | |
| 3239 | 3244 | 3103 | 3108 | 3101 w | 0.5 | 5.49 | 0.1 | 5.62 | ν(C-H)(R2)(99) | |
| 3192 | 3190 | 3058 | 3056 | 3069 w | 12.3 | 12.81 | 16.1 | 15.08 | ν(C-H)(R1)(99) | |
| 3183 | 3177 | 3050 | 3044 | 3044 w | 18.9 | 4.72 | 25.6 | 3.27 | ν(C-H)(R1)(99) | |
| 3171 | 3167 | 3038 | 3034 | 11.0 | 6.20 | 1.8 | 7.06 | ν(C-H)(R1)(99) | ||
| 3163 | 3160 | 3030 | 3027 | 0.5 | 2.77 | 3.1 | 1.33 | ν(C-H)(R1)(99) | ||
| 3065 | 3088 | 2937 | 2958 | 2920 w | 21.9 | 6.27 | 26.0 | 6.42 | νasCH2(85) | |
| 2995 | 3001 | 2870 | 2875 | 2857 w | 70.0 | 9.22 | 51.8 | 6.41 | νssCH2(85) | |
| 1708 w | 1723 | Overtone | ||||||||
| 1648 s | Overtone | |||||||||
| 1657 | 1657 | 1629 | 1629 | 1624 s | 1687 | 4.8 | 4.24 | 4.8 | 4.03 | ν(C-C)(R1)(46)+ δ2(R2)(13)+ ν(C-C)(R2)(9) |
| 1615 | 1613 | 1587 | 1586 | 1590 | 1614 | 0.3 | 4.37 | 0.3 | 3.57 | ν(C-C)(R2) 43)+ ν(C-C)(R1)(35) |
| 1564 m | Overtone | |||||||||
| 1584 | 1581 | 1557 | 1554 | 1519 vs | 1552 | 27.2 | 23.64 | 24.3 | 24.10 | ν(C-C)(R2)(51)+ δ2(R2)(19)+ ν(C-C)(R1)(9) |
| 1522 | 1521 | 1496 | 1495 | 2.4 | 0.71 | 2.5 | 0.75 | ν(C-C)(R1)(36)+ b(C-H)(R1)(33)+ ν(C-N)(R2)(12)+ b(N-H)(R2)(9) | ||
| 1504 | 1508 | 1479 | 1482 | 2.6 | 2.37 | 2.7 | 2.57 | sicsCH2(88)+ sicsCCO(10) | ||
| 1479 | 1479 | 1454 | 1454 | 1448 | 20.5 | 2.36 | 21.1 | 2.44 | ν(C-C)(R1)(43)+ b(C-H)(R1)(33)+ ν(C-N)(R2)(9) | |
| 1444 | 1446 | 1419 | 1421 | 1431 vs | 1419 | 27.1 | 15.93 | 32.4 | 16.59 | ν(C-N)(R2)(25)+ b(N-H)(R2)(24)+ ν(C-C)(R1)(15)+ b(C-H)(R1)(11)+ ν(C-C)(R2)(11) |
| 1417 | 1415 | 1393 | 1391 | 1398 vs | 60.9 | 4.07 | 55.7 | 2.31 | wagCH2(63)+ b(C-O-H)(17) | |
| 1382 | 1379 | 1359 | 1356 | 1348 | 2.2 | 8.73 | 5.3 | 12.47 | ν(C-C)(R2)(27)+ b(C-H)(R1)(22)+ twist CH2(13) | |
| 1368 | 1368 | 1345 | 1345 | 1348 s | 1323 | 18.1 | 8.65 | 22.5 | 4.67 | ν(C-C)(R1)(67)+ δ2(R2)(22) |
| 1335 | 1338 | 1312 | 1315 | 1321 s | 9.7 | 4.07 | 4.1 | 1.94 | β(C-O-H)(27)+ b(C-H)(R1)(15)+ twist CH2(14)+ ν(C-C)(R2)(13)+ wag CH2(13) | |
| 1315 | 1318 | 1292 | 1296 | 1290 s | 5.4 | 2.26 | 7.1 | 3.46 | ν(C-N)(R2)(31)+ b(C-H)(R2)(13)+ δ2(R2)(10)+ wag CH2(9) | |
| 1271 | 1272 | 1249 | 1250 | 1255 m | 1259 | 18.0 | 2.98 | 6.6 | 3.22 | β(C-H)(R1)(40)+ ν(C-C)(R2)(16)+ ν(C-C)(R1)(14) |
| 1245 | 1247 | 1223 | 1226 | 1212 s | 1243 | 4.7 | 6.91 | 5.3 | 6.67 | ν(C-N)(R2)(35)+ ν(C-C)(R1)(14)+ δ2(R2)(12)+ b(C-H)(R2)(10) |
| 1196 | 1199 | 1176 | 1179 | 1164 m | 1162 | 11.2 | 6.85 | 30.4 | 2.98 | Twistb2CH2(40)+ b(C-O-H)(27)+ ν(C-C)(R2)(9) |
| 1175 | 1173 | 1155 | 1153 | 1150 w | 1147 | 0.6 | 1.27 | 7.3 | 1.61 | β(C-H)(R1)(66)+ ν(C-C)(R1)(16) |
| 1151 | 1147 | 1131 | 1128 | 1134 w | 1138 | 1.2 | 1.51 | 1.8 | 1.88 | β(C-H)(R1)(44)+ ν(C-C)(R1)(32) |
| 1109 | 1110 | 1090 | 1091 | 1116 s | 1101 | 27.3 | 0.42 | 29.5 | 0.38 | β(N-H)(R2)(26)+ b(C-H)(R2)(12) + δtrig(R1)(13) |
| 1089 | 1082 | 1070 | 1064 | 1074 s | 1051 | 20.3 | 3.30 | 11.5 | 4.46 | δtrig(R1)(28)+ ν(C-C)(R1)(16)+ δ2(R2)(14) |
| 1032 | 1033 | 1014 | 1015 | 1014 m | 1008 | 9.1 | 12.73 | 8.6 | 12.49 | ν(C-C)(R1)(73) |
| 1016 | 995 | 999 | 978 | 984 w | 985vw | 90.1 | 6.09 | 135.8 | 7.31 | ν(C-O)(71) |
| 978 | 973 | 961 | 956 | 0.1 | 0.16 | 9.5 | 3.88 | γ(C-H)(R1)(82)+ τ1(R1)(14) | ||
| 965 | 972 | 949 | 955 | 928 m | 927 | 46.9 | 2.62 | 10.3 | 2.15 | rock CH2(46)+ ν(C-C)(R2)(10)+ β(C-O-H)(9) |
| 942 | 936 | 926 | 920 | 0.9 | 0.31 | 0.9 | 0.21 | γ(C-H)(R1)(86) | ||
| 889 | 887 | 873 | 872 | 873 s | 867w | 0.7 | 4.23 | 0.9 | 4.72 | δtrig(R1)(29)+ δ2(R2)16)+ δ1(R2)(16)+ ν(C-N)(R2)(11)+ ν(C-C)(R1)(11) |
| 855 | 852 | 841 | 838 | 823 s | 848w | 0.5 | 0.31 | 0.3 | 0.11 | γ(C-H)(R1)(72)+ τ1(R1)(13) |
| 811 | 822 | 797 | 808 | 782 vs | 789w | 11.2 | 2.31 | 10.0 | 1.74 | γ(C-H)(R2)(66)+ τ1(R2)(11) |
| 779 | 777 | 765 | 764 | 757 s | 14.4 | 5.21 | 11.1 | 1.87 | τ1(R1)(38)+ δ2(R2)(18) | |
| 770 | 770 | 757 | 757 | 756 | 3.2 | 13.01 | 4.3 | 17.52 | ν(C-C)(R1)(38)+ τ1(R1)(29)+ δ2(R2)(17) RBM | |
| 750 | 748 | 737 | 735 | 745 s | 85.9 | 0.31 | 87.1 | 0.36 | γ(C-H)(R1)(83) | |
| 733 | 733 | 720 | 721 | 713 w | 6.3 | 4.45 | 6.1 | 3.43 | τ1(R1)(19)+ δas1(R1)(12)+ ν(C-C)(11)+ ν(C-C)(R1)(11)+sicsCCO(9)+δ1(R2)(9) | |
| 663 s | ||||||||||
| 644 | 652 | 633 | 641 | 645 s | 668 | 2.3 | 2.81 | 3.1 | 2.01 | τ1(R1)(20)+ τ2(R2)(15)+ τ1(R2)(14)+γ(C8-C16)(12) |
| 591 | 587 | 580 | 577 | 568 s | 578 | 14.0 | 2.99 | 10.7 | 1.45 | τ2(R2)(40)+ τ1(R1)(11) |
| 581 | 580 | 571 | 570 | 560 | 4.5 | 2.64 | 4.5 | 4.73 | τ1(R1)(38)+γ(C-H)(R1)(14)+ τ1(R2)(11) | |
| 542 | 548 | 532 | 539 | 526 m | 541 | 3.9 | 6.92 | 5.6 | 6.43 | δas2(R1)(32)+ δas1(R1)(20)+ ν(C-C)(R1)(11)+ ν(C-C)(R2)(9) |
| 471 | 464 | 463 | 456 | 450 s | 9.1 | 2.46 | 1.9 | 0.45 | δas1(R1)(20)+ b(C8-C16)(19)+ δ2(R2)(15)+ δas2(R1)(10)+ ν(C-C)(R2)(9) | |
| 429 | 440 | 422 | 433 | 430 w | 12.4 | 0.69 | 33.4 | 4.79 | τ2(R1)(46)+ τ3(R1)(30)+ butt(C1-C2)(11) | |
| 426 | 427 | 419 | 420 | 410 | 429 | 17.1 | 1.83 | 0.1 | 0.74 | τ3(R1)(29)+γ(N-H)(R2)(15)+ sicsCCO(11)+ δ2(R2)(9) |
| 365 | 377 | 359 | 371 | 392 | 76.0 | 2.48 | 51.0 | 2.99 | γ(N-H)(R2)(56)+ τ2(R2)(23) | |
| 325 | 271 | 320 | 266 | 115.6 | 2.54 | 103.4 | 3.52 | τ(C16-O19)(55)+γ(N-H)(R2)(18)+ τ2(R2)(11) | ||
| 247 | 237 | 243 | 233 | 252 | 16.6 | 2.94 | 1.5 | 1.18 | τ2(R1)(17)+ τ2(R2)(11)+γ(C8-C16)(11)+γ(N-H)(R2)(9) | |
| 224 | 218 | 220 | 214 | 228 | 5.8 | 0.23 | 13.0 | 0.44 | τ3(R1)(35)+ butt(C1-C2)(31)+ τ1(R2)(12)+γ(C-H)(R1)(9) | |
| 190 |
199 |
186 | 196 | 8.0 | 3.90 | 11.3 | 3.43 | b(C8-C16)(26)+ τ2(R1)(15)+ τ2(R2)(11)+ butt(C1-C2)(10) | ||
| 110 | 107 | 108 | 105 | 0.4 | 28.62 | 0.5 | 29.15 | γ(C8-C16)(40)+ sicsCCO(16) | ||
| 61 | 54 | 60 | 53 | 1.9 | 21.29 | 2.3 | 27.74 | τ(C8-C16)(71)+γ(C8-C16)(10) | ||
Table 6. Comparison of experimental FT-IR, FT-Raman spectral data, infrared intensities, Raman intensities of molecule I3C along with the assignments of vibrational modes based on PED results.
| S. No. | Symbol | Type | Definitions |
|---|---|---|---|
| Stretching | |||
| 1-6 | ri | C-C (R1) | C1-C2, C2-C3, C3-C4, C4-C5, C5-C6, C6-C1 |
| 7-8 | ri | C-C (R2) | C2-C8, C8-C7 |
| 9-10 | ri | C-N (R2) | C1-N15, C7-N15 |
| 11-14 | ri | C-H (R1) | C3-H9, C4-H10, C5-H11, C6-H12 |
| 15 | ri | C-H (R2) | C7-H14 |
| 16 | ri | N-H (R2) | N15-H13 |
| 17 | ri | C-C | C8-C16 |
| 18 | ri | C-O | C16-O19 |
| 19-20 | ri | C-H | C16-H17, C16-H18 |
| 21 | ri | O-H | O19-H20 |
| In-plane bending | |||
| 22-27 | αi | CCC (R1) | C6-C1-C2, C1-C2-C3, C2-C3-C4, C3-C4-C5, C4-C5-C6, C5-C6-C1 |
| 28-32 | αi | CC-C/N (R2) | C1-N15-C7, N15-C7-C8,C7-C8-C2,C8-C2-C1,C2-C1-N15 |
| 33-40 | αi | CCH (R1) | C2-C3-H9,C4-C3-H9,C3-C4-H10,C5-C4-H10,C4-C5-H11,C6-C5-H11,C5-C6-H12,C1-C6-H12 |
| 41-44 | αi | C(C/N)H (R2) | C8-C7-H14, N15-C7-H14, C7-N15-H13, C1-N15-H13 |
| 45-46 | αi | CCC | C7-C8-C16, C2-C8-C16 |
| 47 | αi | HCH | H17-C16-H18 |
| 48 | CCO | C8-C16-O19 | |
| 49-52 | αi | (C/O) CH | C8-C16-H17, C8-C16-H18, O19-C16-H17, O19-C16-H18 |
| 53 | αi | COH | C16-O19-H20 |
| Out of plane bending | |||
| 54-57 | γi | HCCC (R1) | H9-C3-C2-C4, H10-C4-C3-H5, H11-C5-C4-C6, H12-C6-C5-C1 |
| 58 | γi | HCCN (R2) | H14-C7-C8-N15 |
| 59 | γi | HNCC (R2) | H13-N15-C7-C1 |
| 60 | γi | CCCC | C16-C8-C7-C2 |
| Torsion/Twisting | |||
| 61-66 | τi | CCCC (R1) | C6-C1-C2-C3, C1-C2-C3-C4, C2-C3-C4-C5, C3-C4-C5-C6, C4-C5-C6-C1, C5-C6-C1-C2 |
| 67-71 | τi | CCCC/N (R2) | C1-N15-C7-C8, N15-C7-C8-C2, C7-C8-C2-C1, C8-C2-C1-N15, C2-C1-N15-C7, |
| 72-73 | τi | CCCC/N (Fused) | C8-C2-C1-C6, C3-C2-C1-N15 |
| 74-75 | τi | CCCO | C2-C8-C16-O19, C7-C8-C16-O19 |
| 76 | τi | CCOH | C8-C16-O19-H20 |
Table S1. Definition of internal coordinates of I3C.
| S. No. | Symbol | Definitions | S. No | Symbol | Definitions |
|---|---|---|---|---|---|
| 1-6 | ν(C-C)(R1) | r1, r2, r3, r4, r5, r6 | 33 | β(C8-C16) | (α45-α46)/√2 |
| 7-8 | ν(C-C)(R2) | r7, r8 | 34 | sicsCH2 | (5α47+α48)/√26 |
| 9-10 | ν(C-N)(R2) | r9, r10 | 35 | sicsCCO | (α47+5α48)/√26 |
| 11-14 | ν(C-H)(R1) | r11, r12, r13, r14 | 36 | rock CH2 | (α49-α50+ α51-α52)/2 |
| 15 | ν(C-H)(R2) | r15 | 37 | wag CH2 | (α49+α50-α51-α52)/2 |
| 16 | ν(N-H)(R2) | r16 | 38 | twist CH2 | (α49-α50-α51+α52)/2 |
| 17 | ν(C-C) | r17 | 39 | β(C-O-H) | α53 |
| 18 | ν(C-O) | r18 | 40-43 | γ(C-H)(R1) | γ54, γ55, γ56, γ57 |
| 19 | νasCH2 | (r19+ r20)/√2 | 44 | γ(C-H)(R2) | γ58 |
| 20 | νssCH2 | (r19-r20)/√2 | 45 | γ(N-H)(R2) | γ59 |
| 21 | ν(O-H) | r21 | 46 | γ(C8-C16) | γ60 |
| 22 | δtrig(R1) | (α22-α23+ α24-α25+α26-α27)/√6 | 47 | τ1(R1) | (τ61-τ62+τ63-τ64+τ65-τ66)/√6 |
| 23 | δas1(R1) | (2α22-α23-α24+2α25-α26-α27)/√12 | 48 | τ2(R1) | (τ61-τ63+ τ64-τ66)/√4 |
| 24 | δas2(R1) | (α23-α24+α26-α27)/2 | 49 | τ3(R1) | (-τ61+2τ62-τ63-τ64+2τ65-τ66)/√12 |
| 25 | δ1(R2) | α28+a(α29+ α32)+b(α30+α31) | 50 | τ1(R2) | β(τ67+τ71)+a(τ68+τ70)+τ69 |
| 26 | δ2(R2) | (a-b)(α29-α31)+(1-a)(α30-α32) | 51 | τ2(R2) | (a-b)(τ70-τ68)+(1-a)(τ71-τ67) |
| 27-30 | b(C-H)(R1) | (α33-α34)/√2, (α35-α36)/√2, (α37-α38)/√2, (α39-α40)/√2 |
52 | butt(C1-C2) | (τ72-τ73)/√2 |
| 31 | b(C-H)(R2) | (α41-α42)/√2 | 53 | τ(C8-C16 | (τ74+ τ75)/√2 |
| 32 | b(N-H)(R2) | (α43-α44)/√2 | 54 | τ(C16-O19) | τ76 |
Table S2. Local symmetry coordinates of I3C.
The vibrational bands of carbinol moiety contain molecular vibrations associated with O-H, C-O and CH2 groups. A marked shift in the O–H group vibrations for the hydrogen bonded systems is the key feature of the vibrational spectra these systems. Hydrogen bonded O-H stretching vibrations normally occur in the region around 3500 cm-1-2500 cm-1. In FTIR spectrum of I3C a broad band at 3473 cm-1 is assigned to O–H stretching vibrations. A comparison of this band with that of computed values 3662 cm-1 and 3669 cm-1 for Conf. 1 and Conf. 2 conformers respectively shows positive deviation of~189 cm-1 and 196 cm-1, this may be due to the presence of strong intermolecular hydrogen bonding (O–H· · ·O). The in-plane bending mode of O–H group is identified as a mixed mode vibration having calculated wavenumber 1312/1315 cm-1 for Conf. 1/Conf. 2; these are also in good agreement with strong peak observed at 1321 cm-1 in FT-IR spectrum of I3C. The major difference in the spectra of two conformers is in the C-O stretching vibration calculated at 999 for Conf. 1 and at 978 cm-1 for Conf. 2, the experimental peak is somewhat midway between the two calculated wavenumbers at 984/985 cm-1 in FTIR/FT-Raman spectrum.
Methylene group shows symmetric and asymmetric C-H stretching, CH2 deformation, scissoring, wagging, twisting and rocking normal mode vibrations. The CH2 antisymmetric and symmetric stretching vibrations are generally observed in the region 3000 cm-1-2900 cm-1 and 2900 cm-1-2800 cm-1 respectively [30]. In present case, the simulated wavenumber corresponding to CH2 antisymmetric and symmetric stretching vibrations for Conf. 1/Conf. 2 are found to be 2937/2958 cm-1 and 2870/2875 cm-1 respectively, well matched with literature value [30] and experimental FT-IR bands at 2920 and 2857 cm-1 respectively. The CH2 scissoring vibration is observed at 1479 cm-1 with PED 88%. From the theoretical calculations, the dominant CH2 wagging mode is predicted at 1393 cm-1. It shows excellent agreement with the intense FT-IR band at 1398 cm-1. The peak observed at 1164/1162 cm-1 in FTIR/FT-Raman is assigned as dominant CH2 twisting vibration with corresponding calculated wavenumber 1176/1169 cm-1 in Conf. 1/Conf. 2. Medium intense band at 928/927 cm-1 in FTIR/FT-Raman spectrum of title molecule is assigned as CH2 rocking mode.
Indole ring consist of six-member phenyl ring fused with five-member pyrrole ring. Hence its spectral region primarily involves the phenyl ring vibrations (Labelled R1) (C-C, C=C and C-H stretching, C-C-C, H-C-C-bending and torsion modes vibrations) and pyrrole ring (Labelled R2) vibrations (C-H, N-H, C-C, C=C, C-N stretching and C-C-C, H-C-C, C-N-C bending as well as torsion vibrations). The aromatic C-H stretching vibrations are expected to appear in 3100 cm-1-3000 cm-1 frequency range as a group of partially overlapped bands [16] which is the characteristic region for easy detection of C-H stretching vibrations. In this region, the bands are not affected significantly by the nature of substituent’s [41-43]. In the present work, the prominent simulated C-H stretching peaks associated with fused phenyl ring of Conf. 1 and Conf. 2 conformers were found in region 3058 cm-1-3030 cm-1 and 3056 cm-1-3027 cm-1 respectively, while simulated higher wavenumber 3103/3108 cm-1 (with 99% contribution to the PED) is identified as C-H stretching modes of pyrrole ring.
The C-H in-plane bending vibrations appear sharp but weak to medium intensity bands in 1500 cm-1-1100 cm-1 region. The PEDs of calculated vibrational wavenumbers (Table 6) shows that in-plane C-H bending vibrations of I3C lies in range 1496 cm-1-1131 cm-1. The observed weak to medium intensity bands at 1255 cm-1, 1150 cm-1, 1134 cm-1in FT-IR and at 1259 cm-1, 1147 cm-1, 1138 cm-1in FT-Raman spectra of title compound are assigned as dominant in-plane C-H bending vibrations of I3C molecule. The C-H out-of-plane bending in substituted benzene appears in the range of 1000 cm-1-675 cm-1 [44,45] The strong bands at 823 cm-1, 782 cm-1, 745 cm-1 in FT-IR and weak bands at 848 cm-1, 789 cm-1 in FT-Raman spectrum of I3C along with computed values at 841 cm-1, 797 cm-1 and 737 cm-1 represents prominent out-of-plane C-H vibrations.
In general, the N-H stretching vibration in the heterocyclic compounds shows its presence in the region of 3500 cm-1-3000 cm-1. Intermolecular (N-H----π) hydrogen bonding is clearly manifested in the deviation of theoretical wavenumbers of N-H stretching modes [16]. The observed band at 3370 cm-1 in FT-IR spectrum of I3C compound is assigned as N-H stretching vibration. Deviation of this band with simulated value 3519/3516 cm-1 in Conf. 1/Conf. 2 conformers indicates presence of strong intermolecular hydrogen bonding. The dominant N15-H13 out of plane bending vibration of Conf. 1/Conf. 2 is calculated at 359/371 cm-1, corresponding to experimental peak at 392 cm-1 in the experimental FT-Raman spectra, well matched with N-H out-of-plane bending at 394 cm-1 by Srivastava et al. [16]. The interesting C-C stretching (Kekule) vibrations associated with phenyl ring moiety have been predicted at 1345 cm-1 and the corresponding bands in FT-IR/FT-Raman spectrums is observed at 1348/1323 cm-1. The assignment of indole ring breathing mode at 756 cm-1 in FT-Raman spectrum of the title molecule agrees well with Takeuchi and Harada [45] who have reported indole ring breathing as a strong Raman band at 763 cm-1 and also with literature [16]. The observed and calculated wavenumbers and assignments of present molecule are presented in Table 6.
Natural bond orbital (NBO) analysis
The natural bonding orbital calculation has been performed at B3LYP/6-311++G (d, p) level to analyze the delocalization of electron density between occupied Lewis type (bond/lone pair) NBO orbitals and formally unoccupied (anti-bond/Rydberg) non-Lewis NBO orbitals corresponding to a stabilizing donor-acceptor interactions. This bonding-anti-bonding interaction can be quantitatively described in terms of the NBO approach which is expressed by means of second-order perturbation interaction energy E(2). The calculated second-order interaction energies E(2) between the donor-acceptor orbitals of I3C for both the conformers are collected in Table 7.
| Donor (i) | Type | ED (i) (e) | Acceptor (j) | Type | ED (j) (e)a | E (2)b | E(j)-E(i)c | F(i, j)d |
|---|---|---|---|---|---|---|---|---|
| kcal/mol | (a.u.) | (a.u.) | ||||||
| Conformer 1 | ||||||||
| C1-C2 | π | 1.5914 | C3-C4 | π* | 0.3 | 17.13 | 0.32 | 0.068 |
| π | C5-C6 | π* | 0.33 | 15.54 | 0.33 | 0.065 | ||
| π | C7-C8 | π* | 0.3 | 17.48 | 0.29 | 0.065 | ||
| C3-C4 | π | 1.7231 | C1-C2 | π* | 0.48 | 17.55 | 0.28 | 0.066 |
| π | C5-C6 | π* | 0.33 | 13.2 | 0.33 | 0.06 | ||
| C5-C6 | π | 1.7364 | C1-C2 | π* | 0.48 | 19.06 | 0.28 | 0.07 |
| π | C3-C4 | π* | 0.30 | 14.78 | 0.33 | 0.063 | ||
| C7-C8 | π | 1.8472 | C1-C2 | π* | 0.48 | 15.62 | 0.3 | 0.067 |
| C16-O19 | σ | 1.9918 | C5-C6 | π* | 0.33 | 11.54 | 0.89 | 0.099 |
| σ | C7-C8 | σ* | 0.02 | 19.1 | 1.46 | 0.15 | ||
| σ | C6-O19 | σ* | 0.03 | 16.19 | 1.16 | 0.123 | ||
| σ | O19-H20 | σ* | 0.01 | 151.5 | 4 | 0.695 | ||
| O19-H20 | σ | 1.9904 | C3-C4 | π* | 0.30 | 10.06 | 0.77 | 0.085 |
| σ | C5-C6 | π* | 0.33 | 14.25 | 0.78 | 0.103 | ||
| σ | C7-C8 | σ* | 0.02 | 15.3 | 1.35 | 0.129 | ||
| σ | C16-O19 | σ* | 0.03 | 24.08 | 1.05 | 0.143 | ||
| σ | O19-H20 | σ* | 0.01 | 169.52 | 3.89 | 0.725 | ||
| N15 | LP(1) | 1.6374 | C1-C2 | π* | 0.48 | 33.56 | 0.3 | 0.093 |
| LP(1) | C7-C8 | π* | 0.30 | 32.68 | 0.32 | 0.093 | ||
| O19 | LP(1) | 1.9807 | C16-O19 | σ* | 0.03 | 11.54 | 0.97 | 0.095 |
| O19-H20 | σ* | 0.01 | 83.77 | 3.81 | 0.506 | |||
| Conformer 2 | LP(1) | |||||||
| C1-C2 | π | 1.58587 | C3-C4 | π* | 0.31 | 18.85 | 0.29 | 0.068 |
| C1-C2 | π | C5-C6 | π* | 0.33 | 18.18 | 0.28 | 0.065 | |
| C1-C2 | π | C7-C8 | π* | 0.30 | 16.91 | 0.3 | 0.065 | |
| C3-C4 | π | 1.73103 | C1-C2 | π* | 0.49 | 17.42 | 0.28 | 0.066 |
| C3-C4 | π | C5-C6 | π* | 0.33 | 19.5 | 0.29 | 0.068 | |
| C5-C6 | π | 1.7348 | C1-C2 | π* | 0.49 | 18.95 | 0.28 | 0.069 |
| C5-C6 | π | 1.7348 | C3-C4 | π* | 0.31 | 16.83 | 0.3 | 0.064 |
| C7-C8 | π | 1.83975 | C1-C2 | π* | 0.49 | 16.44 | 0.29 | 0.068 |
| C16-O19 | σ | 1.99084 | C16-H18 | σ* | 0.02 | 9.85 | 1.31 | 0.102 |
| C16-O19 | σ | O19-H20 | σ* | 0.01 | 64.08 | 3.25 | 0.408 | |
| O19-H20 | σ | 1.98975 | C16-H18 | σ* | 0.02 | 16.52 | 1.22 | 0.127 |
| O19-H20 | σ | O19-H20 | σ* | 0.01 | 49.31 | 3.16 | 0.353 | |
| N15 | LP(1) | 1.63172 | C1-C2 | π* | 0.49 | 34.03 | 0.3 | 0.093 |
| N15 | LP(1) | C7-C8 | π* | 0.30 | 32.26 | 0.33 | 0.093 | |
| O19 | LP(1) | 1.97912 | O19-H20 | σ* | 0.01 | 12.82 | 3.07 | 0.178 |
aED: Electron Density
bE(2): Mean energy of Hyper conjugative interactions
dE(j)-E(i): Energy difference between donor and acceptor i and j NBO orbitals
dF(i,j): The fock matrix element between i and j NBO orbitals
Table 7. Second order perturbation theory analysis of fock matrix on NBO basis for both conformers of I3C (E(2)>10 kcal/mol).
Strong intra-molecular hyper conjugative interaction, of bonding σ electrons of (O19-H20) with antibonding σ* (O19-H20), σ*(C16-O19) π*(C5-C6) and π*(C3-C4) (interaction energies 169.52, 24.08, 14.25 and 10.06 kcal/mol respectively) for conf. 1. The interaction in the compound due to overlapping of lone pair (LP1) of N15 over π*(C1-C2), π*(C7-C8), σ* (C16-O19) and σ* (O19-H20) results in stabilization of 33.56 kcal/mol, 32.68 kcal/mol, 11.54 kcal/mol and 83.77 kcal/mol respectively. The E(2) values of indole 3-carbinol (Table 7) also indicates the strong intra-molecular hyper-conjugation interactions formed by the orbital overlap between ring’s (C-C) bonding and (C-C) anti-bond orbitals which results in intra-molecular charge transfer (ICT) causing stabilization of the system. These interactions are observed as an increase in electron density (ED) in C-C anti-bonding orbital that weakens the respective bonds. These intra-molecular charge transfer (LP→σ*, LP→π*, σ→σ*, σ→π* and π→π*) may induce large nonlinearity to the molecule and the high intra molecular hyper-conjugative interaction around the ring may further induce the large bioactivity in the compound.
Thermodynamic properties
The standard statistical thermodynamic functions: heat capacity  entropy
  and enthalpy changes
  for both conformers of compound studied were obtained on the basis of vibrational analysis using DFT-B3LYP/6-311++G (d, p) in the temperature range 100 K to 700 K and are listed in Table S3 (supplementary material). It is often useful to know these thermodynamic quantities, for each of the materials entering into any kind of chemical reaction. For the computation of thermodynamic data, Gaussian program assumes the non-interacting particle system and the ideal gas approximation. The calculated zero-point vibrational energy and rotational constants of Conf. 1/Conf. 2 conformers at standard temperature (298.15K) are found to be 101.62377/101.56537 Kcal/mol and 1.99437/2.08178, 0.93583/0.89194, 0.66205/0.65568 GHz respectively.
| T(K) |  (cal.mol-1K-1) |
 (cal.mol-1 K-1) (cal.mol-1 K-1) |
 (kcal.mol-1) |
|||
|---|---|---|---|---|---|---|
| Conf. 1 | Conf. 2 | Conf. 1 | Conf. 2 | Conf. 1 | Conf. 2 | |
| 100 | 13.475 | 13.732 | 67.068 | 67.461 | 1.107 | 1.124 |
| 200 | 24.202 | 24.343 | 80.970 | 81.511 | 3.174 | 3.212 |
| 300 | 36.261 | 36.120 | 93.850 | 94.199 | 6.391 | 6.369 |
| 400 | 47.840 | 47.900 | 106.472 | 107.077 | 10.806 | 10.862 |
| 500 | 57.672 | 57.718 | 118.683 | 119.300 | 16.297 | 16.357 |
| 600 | 65.620 | 65.654 | 130.289 | 130.914 | 22.675 | 22.740 |
| 700 | 72.018 | 72.044 | 141.209 | 141.838 | 29.767 | 29.834 |
Table S3. Thermodynamical parameters of I3C molecule calculated at different temperatures using DFT/B3-LYP/6-311++G (d, p) method.
The correlation graphs for thermodynamic properties with respect to temperature (T) for both conformers, shown in Figure 12, indicates that values of heat capacity, entropy and enthalpy increases with the increase of temperature, which is justified due to the enhancement of molecular vibrational intensities with the temperature. The correlation equations between entropy, heat capacity, enthalpy changes and temperatures were fitted by quadratic formulas and the corresponding fitting factors (R2) of these thermodynamic properties for conformer 1 are 1.0000, 0.9988 and 0.9999 respectively. The corresponding fitting equations are as follows-
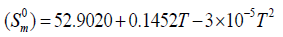
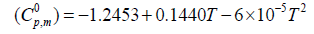


Figure 12: Correlation graph of thermodynamical properties such as heat capacity, entropy and enthalpy change for the both conformer of title molecules calculated at various temperatures.
All the thermodynamic data may deliver useful information for the further study on title compound. These parameters are useful in thermo-chemical field as they can be used to compute the other thermodynamic energies and estimate directions of chemical reactions according to relationships of thermodynamic functions and using second law of thermodynamics. It is important to note that all thermodynamic calculations were done in gas phase and they could not be used in solution.
Conclusion
In the present work, a systematic structural and vibrational analysis has been performed for I3C. To ascertain the existence of either one or two conformer(s) of the title compound we have investigated the effect of functionals and basis sets on vibrational wavenumbers. The energy difference between the two conformers is computed to be less than 1 kcal/mol, a significant Boltzmann population is expected for conf. 2 at the room temperature. Our theoretical results are in line with Latosinska et al. and our studies confirm the existence of two conformers of I3C with unequal proportions. The major difference in the spectra of two conformers is in the region 1200 cm-1-700 cm-1, in particular in the C-O stretching vibration wavenumber. It is calculated at 999 for Conf. 1 and at 978 cm-1 for Conf. 2, the experimental peak is somewhat intermediate between the two calculated wavenumbers, at 984/985 cm-1 in FTIR/FT-Raman spectrum. Simulated UV spectra of the two conformers are almost identical with peaks arising due to the similar transitions in both the conformers except Conf. 1 having higher oscillator strength as compared to Conf. 2 for the corresponding transition. A decent agreement between experimental and calculated combined spectra of the Conf. 1 and Conf. 2 (70% and 30% contribution) has been observed at B3LYP/6- 311++G (d, p).
References
- Aggarwal BB, Ichikawa H. Molecular targets and anticancer potential of indole-3-carbinol and its derivatives. Cell Cyc. 2005;4(9):1201-15.
- Sarkar FH, Li Y. Indole-3-carbinol and prostate cancer. J Nutr. 2004;134:3493-8.
- Moiseeva EP, Almeida GM, Jones GD, et al. Extended treatment with physiologic concentrations of dietary phytochemicals results in altered gene expression, reduced growth and apoptosis of cancer cells. Mol Cancer Ther. 2007;6(11):3071-9.
- Ahmad A, Sakr WA, Rahman KMW. Anticancer properties of indole compounds: Mechanism of apoptosis induction and role in chemotherapy. Curr Drug Targets. 2010;11(6):652-66.
- Hsu JC, Dev A, Wing A, et al. Indole-3-carbinol mediated cell cycle arrest of LNCaP human prostate cancer cells requires the induced production of activated P53 tumor suppressor protein. Biochem Pharmacol. 2006;72(12):1714-23.
- Melkamu T, Zhang XX, Tan JK, et al. Alteration of microRNA expression in vinyl carbamate-induced mouse lung tumors and modulation by the chemopreventive agent indole-3-carbinol. Carcinog. 2010;31(2):252-8.
- Kim DS, Jeong YM, Moon SI, et al. Indole-3-carbinol enhances ultraviolet B-induced apoptosis by sensitizing human melanoma cells. Cell Mol Life Sci. 2006;63(22):2661-68.
- Machijima Y, Ishikawa C, Sawada S, et al. Anti-adult T-cell leukemia/lymphoma effects of indole-3-carbinol. Retrovirology. 2009;6:7.
- Jin L, Qi M, Chen DZ, et al. Indole-3-carbinol prevents cervical cancer in human papilloma virus type 16 (HPV16) transgenic mice. Cancer Res. 1999;59(16):3991-7.
- Qi M anderson AE, Chen DZ, et al. Indole-3-carbinol prevents PTEN loss in cervical cancer in vivo. Mol Med. 2005;11:59-63.
- Quirit JG, Lavrenov SN, Poindexter K, et al. Indole-3-carbinol (I3C) analogues are potent small molecule inhibitors of NEDD4-1 ubiquitin ligase activity that disrupt proliferation of human melanoma cells. Biochemical Pharmacology. 2017;127:13-27.
- Lin H, Gao X, Chen G, et al. Indole-3-carbinol as inhibitors of glucocorticoid-induced apoptosis in osteoblastic cells through blocking ROS-mediated Nrf2 pathway. Biochem Biophys Res Comm. 2015;460:422-7.
- Latosinska JN, Latosinska M, Szafranski M, et al. Impact of structural differences in carcinopreventive agents indole-3-carbinol and 3, 3 '-diindolylmethane on biological activity. An X-ray, H-1-N-14 NQDR, C-13 CP/MAS NMR and periodic hybrid DFT study. Europ J Pharmac Sci. 2015;77:141-53.
- Ahna A, Min A, Moon CJ, et al. Spectroscopic study of jet-cooled indole-3-carbinol by laser desorption technique: Franck-Condon simulations and anharmonic calculations. Chem Phy Lett. 2015;638:237-243.
- Shukla VK, Al-Abdullah ES, El-Emam AA, et al. Spectroscopic (FT-IR, FT-Raman and UV-visible) and quantum chemical studies on molecular geometry, Frontier molecular orbitals, NBO, NLO and thermodynamic properties of 1-acetylindole. Spectrochim Acta Part A. 2014;133:626-38.
- Srivastava R, Al-Omary F AM, El-Emam AA. et al. A combined experimental and theoretical DFT (B3LYP, CAM-B3LYP and M06-2X) study on electronic structure, hydrogen bonding, solvent effects and spectral features of methyl 1H-indol-5-carboxylate. J of Mol Struc. 2017;1137:725-41.
- Kohn W, Sham LJ. Self-consistent equations including exchange and correlation effects. Phys Rev. 1965;140:1133-8.
- Becke AD. Density?functional thermochemistry. III. The role of exact exchange. J Chem Phys. 1993;98:5648-52.
- Lee C, Yang W, Parr RG. Development of the Colic-Salvetti correlation-energy formula into a functional of the electron density. Phys Rev B. 1998;37:785-9.
- Tawada Y, Tsuneda T, Yanagisawa S, et al. A long-range-corrected time-dependent density functional theory. J Chem Phys. 2004;120:8425-33.
- Zhao Y, Schultz NE, Truhlar DG. Exchange-correlation functional with broad accuracy for metallic and nonmetallic compounds, kinetics and noncovalent interactions. J Chem Phys. 2005;123:1611031-4.
- Frisch MJ, Trucks GW, Schlegel HB, et al. GaussView Version 5.0.8, Gaussian, Inc., 2009.
- Pathak SK, Srivastava R, Sachan AK, et al. Experimental (FT-IR, FT-Raman, UV and NMR) and quantum chemical studies on molecular structure, spectroscopic analysis, NLO, NBO and reactivity descriptors of 3, 5-Difluoroaniline. Spectrochimica Acta Part A: Mol Biomol Spectro. 2015;135:283-295.
- Sinha L, Prasad O, Chand S, et al. FT-IR, FT-Raman and UV spectroscopic investigation, electronic properties, electric moments and NBO analysis of anethole using quantum chemical calculations. Spectrochimica Acta Part A: Mol Biomol Spectro. 2014;133:165-77.
- Sundius T. A new damped least-squares method for the calculation of molecular force fields. J Mol Spectrosc. 1980;82:138-51.
- Sundius T. Molvib: A flexible program for force field calculations. J Mol Struct. 1990;218:321-6.
- Sundius T. Scaling of ab initio force fields by MOLVIB. Vib Spectrosc. 2002;29:89-95.
- Buckingham AD. Intermolecular forces. Adv Chem Phys. 1967;12:107-42.
- Glendening ED, Landis CR, Weinhold F. Natural bond orbital methods. WIREs Comput Mol Sci. 2012;2:1-42.
- Fleming I. Frontier Orbitals and Organic Chemical Reactions. John Wiley & Sons, New York. 1976.
- Murray JS, Sen K. Molecular Electrostatic Potentials. Concepts and Applications, Elsevier, Amsterdam. 1996.
- Alkorta I, Perez JJ. Molecular polarization potential maps of the nucleic acid bases. Int J Quantum Chem. 1996;57:123-35.
- Scrocco E, Tomasi J. Electronic molecular structure, reactivity and intermolecular forces: An Euristic interpretation by means of electrostatic molecular potentials. Adv in Quantum Chem. 1978;11:114-93.
- Luque FJ, Orozco M, Bhadane PK. SCRF calculation of the effect of water on the topology of the molecular electrostatic potential. J Phys Chem. 1993;97:9380-4.
- Sponer J, Hobza P. DNA base amino groups and their role in molecular interactions: Ab initio and preliminary density functional theory calculations. Int J Quantum Chem. 1996;57:959-70.
- Gadre SR, Shrivastava IH. Shapes and sizes of molecular anions via topographical analysis of electrostatic potential. J Chem Phys. 1991;94:4384-90.
- Kleinman DA. Nonlinear dielectric polarization in optical media. Phys Rev. 1962;126:1977-9.
- Pulay P, Fogarasi G, Pang F, et al. Systematic ab initio gradient calculation of molecular geometries, force constants and dipole moment derivatives. J Am Chem Soc. 1979;101:2550-60.
- Fogarasi G, Zhou X, Taylor P, et al. The calculation of ab initio molecular geometries: Efficient optimization by natural internal coordinates and empirical correction by offset forces. J Am Chem Soc. 1992;114:8191-201.
- Sajan D, Binoy J, Pradeep B, et al. NIR-FT Raman and infrared spectra and ab initio computations of glycinium oxalate. Spectrochim Acta part A. 2004;60:173-80.
- Varsanyi G. Assignments for Vibrational Spectra of Seven Hundred Benzene Derivatives, vols. 1 and 2, Academic Kiado, Budapest. 1973.
- Jag M. Organic Spectroscopy-Principles and Applications, 2nd ed., Narosa Publishing House, New Delhi. 2001.
- Varsanyi G. Vibrational Spectra of Benzene Derivatives, Academic Press, NewYork. 1969.
- Bellamy LJ. The Infra-red Spectra of Complex Molecules, Chapman and Hall Ltd., London. 1975.
- Takeuchi H, Harada I. Normal coordinate analysis of the indole ring. Spectrochim Acta Part A. 1986;42:1069-78.
