Research
, Volume: 19( 7)Stickies Monitoring for Improved Paper Recycling Efficiencies
Jerome Andrew*, Bruce Sithole
Department of Scientific and Industrial Research, University of South Africa, Pretoria, South Africa
*Corresponding author: J Andrew, Department of Scientific and Industrial Research, University of South Africa, Pretoria, South Africa. E-mail: jandrew@csir.co.za
Received: July 29, 2021; Accepted: August 12, 2021; Published: August 19, 2021
Abstract
Recovered paper and board has become a valuable raw material resource in the manufacture of paper, from both an economic and environmental sustainability point of view. However, the paper recycling process faces several challenges related to ‘stickies’ present in the recovered paper and board. Stickies refer to the tacky, hydrophobic, pliable organic materials present in recovered paper and board that are derived from pressure sensitive and hot melt adhesives. It is estimated that stickies related problems are costing United States paper manufacturers several hundred million dollars per year, mainly due to product quality problems such as holes, dark spots and reduced strength of the finished products. Run-ability problems such as sheet breaks that arise due to deposits on the wire, felts, press rolls, drying cylinders and calenders also result in long periods of downtime for cleaning. This study proposes new methodologies for the measurement of micro- and potential secondary stickies that are difficult to remove from paper recycling processes due to their small size.
Keywords
Paper recycling; Microstickies; Potential secondary stickies
Introduction
The forestry, timber pulp and paper industry plays an important role in the economies of many countries around the world. In South Africa, the industry contributes around 2% to the total Gross Domestic Product (GDP) and employs around 150 000 people (Forestry South Africa). In particular, the pulp and paper sector produces around 2.2 million tons of paper and board, of which around 1.4 million tons is recovered and recycled (Paper Recycling Association of South Africa, PRASA). As a result, recovered paper and board has become a valuable raw material resource in the papermaking process, from both an economical and environmental sustainability point of view. According to PRASA, every ton of recovered paper recycled replaces virgin fibre from 17 pine trees and frees up about 3 m2 of landfill space by diverting the waste paper from landfill. Paper recycling also results in the reduction of coal-based emissions of up to 1 ton of CO2 and electricity-based emissions of 1.8 tons of CO2 for every ton of recovered paper recycled. Overall, the production of paper from recovered paper is more energy and water efficient, saving up to 2.9 GJ of energy per ton of paper produced, and reducing water consumption by 50% and waste water generation by 35% compared to paper produced from virgin fibre [1]. It is therefore no surprise that due to the economic and environmental advantages of utilizing recovered paper, paper recycling is a rapidly growing science encompassing disciplines such as engineering, biology, chemistry and clean production technologies. However, one of the many challenges facing paper manufactures both globally and in South Africa is the problem of stickies in recovered paper. Stickies refer to the tacky, hydrophobic, pliable organic materials found in paper recycling systems. Although there are no figures available in South Africa, it has been estimated that stickies related problems are costing United States paper manufacturers several hundred million dollars per year.
This is mainly due to product quality problems such as holes, dark spots and reduced strength of the finished products. Runnability problems such as sheet breaks that arise due to deposits on the wire, felts, press rolls, drying cylinders and calenders also result in long periods of downtime for cleaning.
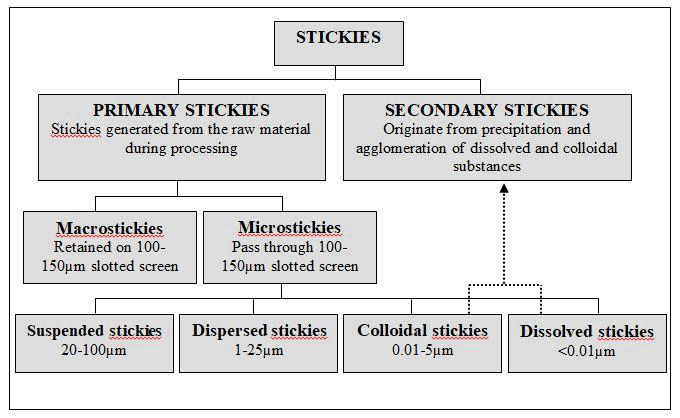
Stickies are derived mainly from Pressure Sensitive Adhesives (PSA), Hot Melt Adhesives (HMA) or a combination of both. Pressure sensitive adhesives are used in labels and tapes and are tacky and flexible at ambient temperature. Hot melts are used in bindings and are usually solid at ambient temperature. Other main sources of stickies include printing inks and coating binders. Generally, stickies are classified as either primary or secondary. Primary stickies are generated from the raw material during processing and remain solid throughout the papermaking process. They are further classified into macrostickies (>100µm in size) or microstickies (<100µm in size). Secondary stickies originate from precipitation and agglomeration of Dissolved or Colloidal Substances (DCS) as a result of abrupt physico-chemical changes in process conditions such as temperature shocks, pH changes, addition of cationic polyelectrolytes, etc. Potential secondary stickies are the colloidal or dissolved substances that have not yet formed secondary stickies but have the potential to do so. A schematic description for the size classification of stickies is given in (Figure 1).
Most paper recycling mills are equipped to efficiently remove macrostickies due to advances in screening and cleaning technologies. As a result, macrostickies should pose little or no process problems in modern mills. However, in the case of microstickies, these particles are small enough to pass through slotted screens. Accumulation and agglomeration of microstickies in the paper machine water loop often leads to deposition resulting in the many problems mentioned previously. A survey of papermakers in South Africa revealed that very few, if any, of the recycling mills measure microstickies on a regular basis, and this may well be the same in other countries. Some of the reasons alluded to include the unavailability of a standard method to measure microstickies, the need for sophisticated equipment and expertise, long turnaround times, complex methodologies, etc. The industry expressed its need for a quick and simple measurement method that was inexpensive and easy to implement in a mill environment.
The literature is replete with references to methods for measurement of microstickies. A few examples include in which samples containing microstickies were placed in a hemacytometer chamber and counted with the aid of a light microscope. The microstickies were distinguishable from fines and other debris by their spherical shape and brilliance under transmitted light. The method was used to determine the effect of cationic polymers, salts and fibres on the stability of model microstickies particles created from an acrylic microsphere adhesive emulsion [2]. Due to the simplicity and quick turnaround times of the method, it was decided to test the applicability of the method on pulp samples obtained from two paper recycling mills. Additionally, using this technology, a new method was developed to measure potential secondary stickies,
Materials and Methods
Sampling
Pulp samples were collected from two paper recycling mills. The first mill was a packaging mill that recycled Old Corrugated Cardboards (OCC) for the production of testliner and linerboard. The second mill recycled a mixture of Old Newspapers (ONP) and Sorted Books and Magazines (SBM) for production of newsprint. In most instances samples taken at the repulper
were used for the method developmental work. In order to test the applicability of the method throughout the process, samples were taken at various points in the mill operations.
Measurement of microstickies
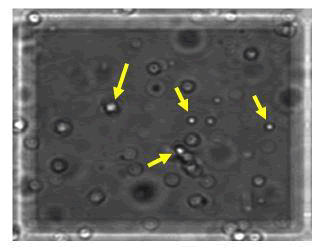
According hemacytometer slide can be used in conjunction with a light microscope to measure microstickies. The method is adapted from the field of medicine in which it is used to count blood cells. The hemacytometer is a blood counting chamber into which a sample is pipetted using a micropipette. The slide is then viewed under a light microscope and the number of cells in the sample is counted. In adaptation of the method for the measurement of microstickies, the pulp filtrate sample was placed in the hemacytometer slide and the number of microstickies particles was counted. The microstickies were easily distinguishable by their spherical shape and brilliance under transmitted light. Pulp samples obtained from mills were thoroughly mixed and 100g oven dry equivalent pulp was taken for analysis. The pulp slurry was filtered under vacuum through a 100µm wire screen placed in a Buchner funnel attached to a Buchner flask. The filtrate thus obtained was transferred to a beaker and continuously stirred with a magnetic stirrer [3]. From this, an aliquot of the pulp filtrate was pippetted onto the hemacytometer slide, and with the aid of a light microscope, microstickies were quantified by counting (Figure 2).
Figure 2: Single counting block in hemacytometer counting chamber showing brilliant, spherical microstickies particles.
Results and Discussion
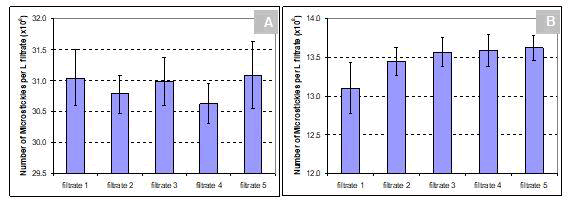
The method was initially tested on two pulp samples obtained from the repulpers of a newsprint mill recycling a mixture of Old Newspapers (ONP) and Sorted Books and Magazines (SBM), and a packaging mill recycling Old Corrugated Cardboard (OCC). In order to determine the repeatability of the method, each pulp sample from the respective mills was divided into five subsamples and each subsample was filtered as described previously to obtain the filtrate. Five replicate measurements for microstickies content were then carried out on each filtrate. The results of the repeatability study are shown in Figure 3 for both mills. For the newsprint mill pulp sample, the individual Coefficient of Variation (COV) of the method obtained for each filtrate was 1.45% on average. The overall COV for the five filtrates from the newsprint mill was less than 1%, at 0.63%. For the packaging mill, individual COV values of 1.8% were obtained, with the overall COV for the five filtrates at 1.6% (Figure 3).
Figure 3: Repeatability of hemacytometer method to measure microstickies in newsprint mill pulp samples (A) and packaging mill pulp samples (B) taken at the repulper. Error bars indicate 2? standard error.
The method was then tested on pulp samples collected throughout the process of both the newsprint and the packaging mill. For the newsprint mill, pulp samples were obtained at several points in the recycling process: Repulper (RP), primary coarse screen feed (PCSF), Primary Coarse Screen Accept (PCSA), Out of Flotation (OF), accepts After Centrifugal Cleaners (ACC), Primary Fine Screen Accepts (PFSA), Before Wire Press (BWP), After Wire Press (AWP), Medium Consistency (MC) pump, and finally at the Storage Tower (ST). The objective of this work was to test the sensitivity of the method to pick up changes in microstickies concentration across the process. In order to verify the results, turbidity measurements of the filtrates were carried out as this method is often used to give an indirect measure of the amount of microstickies.
The results that the microstickies concentration was the highest at the start of the process at the repulper. Thereafter, the concentration decreased rapidly for the sample taken at the primary coarse screen feed. This may be attributed to dilution of the pulp exiting the repulper. Beyond this point, the microstickies concentration remained fairly constant up until the wire press. After the wire press, an elevated microstickies concentration was observed. In this case, the higher concentration may be attributed to an accumulation of microstickies in the pulp pad as the consistency of the pulp increased during dewatering. The pulp sampled at the medium consistency pump showed a lowered concentration of microstickies which could be due to the dispersion stage that preceded the pump. Measurement of turbidity of the pulp filtrates at the various stages in the process revealed a trend consistent with that obtained using the hemacytometer method, i.e., both methods showed elevated levels of microstickies at the repulper and after the wire press. That there was a strong correlation between turbidity measurements and measurement of microstickies using the hemacytometer method.
The during the period of the study, according to the results obtained using the hemacytometer method, microstickies concentration remained fairly constant throughout the process. However, slightly elevated concentrations were observed after primary coarse screening (the Secondary Coarse Screen Feed (SCSF) is the reject stream after primary coarse screening), and after primary and secondary fine screening. This may be attributed to the possible breakdown of macrostickies into microstickies particles during screening resulting in increased concentration of microstickies. Measurement of turbidity at the same stages of the process revealed similar trends in that the turbidity remained fairly constant throughout the process, with slight elevations during coarse and fine screening. The correlation obtained between turbidity measurements of the filtrate and measurement of microstickies using the hemacytometer method.
The hemacytometer method appeared to be simple enough to measure microstickies. But could it be used to measure potential secondary stickies? By definition, potential secondary stickies are the dissolved and colloidal substances that have not yet formed stickies, but have the potential to do so. In their study on the development of a method to measure potential secondary stickies, used turbidity difference of the process water at the process pH and an adjusted pH of 4 as an indication of potential secondary stickies. The method was based on the principle that pH affected the solubility of dissolved and colloidal substances. When the pH of the process water was lowered, the turbidity increased due to the soluble substances precipitating out of solution and becoming visible. Could the hemacytometer method be used to measure the dissolved and colloidal stickies that have precipitated out of solution after a pH shock of the solution?
According to the procedure a sample of the process water was centrifuged for up to 15 minutes to remove suspended solids so that the measured turbidity would represent only the dissolved and colloidal substances in the water sample. In order to verify the centrifugation time in this study, approximately 100g Oven Dry (OD) equivalent pulp sample was filtered as described previously. The filtrate was then decanted into 15ml centrifuge tubes and centrifuged at 3500 rpm for 0, 15, 30, 45, 60, and 75 minutes time intervals. At each time interval, one sample was removed and the turbidity was measured. In addition, microstickies concentration was also measured to determine if any was present in the centrifugate. The results in that there was a significant drop in turbidity from 3000 NTU for the un-centrifuged filtrate to 300 NTU for the filtrate centrifuged for 15 minutes [4]. Thereafter there was a gradual drop in turbidity with increasing centrifugation time. After 60 minutes centrifugation time, the turbidity of the filtrate reached a constant level around 100 NTU. Similarly, microstickies concentration also decreased with increasing centrifugation time, and after 75 minutes centrifugation reached almost zero. At this point, the filtrate that was centrifuged for 75min was acid shocked by rapidly lowering the pH of the sample to 4 using 10% sulphuric acid. The turbidity and microstickies concentration was then re-measured. As expected, the turbidity of the solution increased from 100 NTU to 150 NTU, indicating the precipitation of the dissolved and colloidal substances in the filtrate that resulted in an increase in the turbidity. Measurement of the microstickies concentration using the hemacytometer method also revealed an increase in its concentration [5]. Could the increase in turbidity be attributed to the precipitation of colloidal and dissolved stickies, and was the hemacytometer method sensitive enough to pick this up?
Conclusions
Due to the advances in screening and cleaning technologies, most paper recycling mills are equipped to efficiently remove macrostickies. As a result, macrostickies should pose little or no process problems in modern mills. However, in the case of microstickies, these particles are small enough to pass through slotted screens. Accumulation and agglomeration of microstickies in the paper machine water loop often leads to deposits resulting in runnability and/or product quality problems. South African papermakers have expressed their need for simple and quick methods to measure microstickies with minimal capital investment and are easy to implement in a mill environment. In this study, the use of a hemacytometer and light microscope to measure microstickies was demonstrated. The method was found to be simple and quick with good repeatability. The method was evaluated in a newsprint and packaging mill and was sensitive enough to detect changes in the microstickies concentration at various stages in the process. Good correlations were found between microstickies concentration and turbidity of the process waters of both mills. In addition, the method was extended to include the measurement of dissolved and colloidal stickies that have not yet formed microstickies, but have the potential to do so when the temperature, pH, or chemical environment changes abruptly. It is anticipated that routine measurements will assist mills in establishing baselines for the concentration of microstickies and potential secondary stickies in their process. By relating spikes in concentrations to product quality and runnability problems, a threshold value for microstickies and potential secondary stickies could be determined, above which could indicate agglomeration, or in the case of potential secondary stickies, precipitation, which ultimately will lead to accumulation and agglomeration. Mills can objectively assess their current approaches to dealing with microstickies and if necessary, optimise additives dosages, determine the best addition points for these additives, and the optimal process conditions for functioning of the additives.
Acknowledgements
Mondi and Sappi are thanked for access to mill pulp samples.
References
- Blanco Suarez A, Miranda Carreno R, Negro Alvarez CM, et al. Full characterization of stickies in a newsprint mill: The need for a complementary approach. Tappi Journal. 2007;6(1):19-25.
- Miranda Carreno R, Blanco Suarez A, Negro Alvarez CM, et al. Stickies removal in a deinking line of a newsprint mill: Efficiency of the different process stages. Cell Chem Technol. 2006;40(9-10):775-782.
- Lee HL, Kim JM. Quantification of macro and micro stickies and their control by flotation in OCC recycling process. Appita: Technology, Innovation, Manufacturing. Environment. 2006;59(1):31-36.
- Ballinas-Casarrubias L, Gonzalez-Sanchez G, Eguiarte-Franco S, et al. Chemical Characterization and Enzymatic Control of Stickies in Kraft Paper Production. Polymers. 2020;12(1):245.
- Miranda R, Balea A, Blanca ES, et al. Identification of recalcitrant stickies and their sources in newsprint production. Indus Engi Chem Res. 2008;47(16):6239-6250.


