Research
, Volume: 17( 1) DOI: 10.37532/0974-7494.2023.17(1).187Relative Humidity Monitoring of Ag Doped TiO2
- *Correspondence:
- Anupam Kumar TripathiDepartment of Physics, Faculty of Engineering & Technology,University of Lucknow, Lucknow U.P. India ; E-mail: tripathi198117@gmail.com
Received date: 16-March-2023, Manuscript No. tsnsnt-23-92675; Editor assigned: 18-March-2023, PreQC No. tsnsnt-23-92675 (PQ);Reviewed: 21-March-2023, QC No. tsnsnt-23-92675 (Q); Revised: 24-March-2023, Manuscript No. tsnsnt-23-92675 (R); Published: 31-March-2023. DOI: 10.37532/0974-7494.2023.17(1).187
Citation: Tripathi A.K., Kumar A. Relative Humidity Monitoring of Ag Doped TiO2. Nano Tech Nano Sci IndJ.2023;17(1):187
Abstract
Practical applications of TiO2 are limited due to its wide band gap and fast recombination of electron-hole pairs within nanoseconds. So far numerous researches have been focused on defeating these disadvantages by introducing noble metals into titania lattice. Noble metals deposited or doped in TiO2 have high Schottky barriers among the metals and act as electron traps, facilitating electron-hole separation and promoting the interfacial electron transfer process. These additives capture electrons resulting in a lower recombination rate of electron-hole pairs. However, some noble metals such as Pt, Pd, Rh, and Au are too expensive to be used on the industrial scale. Therefore, the research on Ag-doped TiO2 has significant practical value. Silver is suitable for industrial applications due to its comparable cost and easy preparation. It is a suitable element, which improves the TiO2 photo-catalytic performance, it is also believed that the silver ions interact with sulfur, oxygen, and nitrogen in the molecules of microorganisms and inactivate the cellular proteins resulting in titania as better bioactive material. Ag-doped titania layers with different morphologies have been grown by the Sol-gel method.
Keywords
Bioactive material, Electron-hole recombination, Humidity sensors, Photo-catalytic performance
Introduction
Practical applications of TiO2 are limited due to its wide band gap and fast recombination of electron-hole pairs within nanoseconds. So far numerous researches have been focused on defeating these disadvantages by introducing noble metals into titania lattice. Noble metals deposited or doped in TiO2 have high Schottky barriers among the metals and act as electron traps, facilitating electron-hole separation and promoting the interfacial electron transfer process. These additives capture electrons resulting in a lower recombination rate of electron-hole pairs (227). However, some noble metals such as Pt, Pd, and Au are too expensive to be used on the industrial scale.
Therefore, the research on Ag-doped TiO2 has significant practical value. Silver is suitable for industrial applications due to its comparable cost and easy preparation. It is a suitable element that improves the TiO2 photo-catalytic performance, it is also believed that the silver ions interact with sulfur, oxygen, and nitrogen in the molecules of microorganisms and inactivate the cellular proteins resulting in titania as better bioactive material. Ag-doped titania layers with different morphologies have been grown by the Sol-gel method.
As the Fermi levels of these noble metals are lower than that of TiO2, photoexcited electrons can be transferred from the conduction band to the metal particles deposited on the surface of TiO2, while photogenerated valence holes remain in TiO2. These activities greatly reduce the possibility of electron-hole recombination, resulting in efficient separation and stronger photo-catalytic reactions [1].
Experimental Procedure
The synthesized TiO2 powder was doped with Ag with 20 wt% and made fine by grinding it in a mortar with a pestle for 2 hrs. The pellet of this material having dimensions 9 mm in diameter and 3 mm in thickness, has been made by hydraulic pressing machine (M.B. Instruments, Delhi, India) under the pressure of 616 M Pa at room temperature. This pellet TA-20 was annealed in an electric muffle furnace (Ambassador, India) at 500°C, 600°C, and 700°C for 3 hrs successively and after each annealing process exposed to humidity in the humidity chamber. Inside the humidity chamber, a thermometer (± 10°C) and standard hygrometer (Huger, Germany, ± 1RH%) are placed for the purpose of calibration. Variation in resistance was recorded with the change in relative humidity. The pellet’s resistance variation was recorded using a resistance meter (Sino meter ±0.001MΩ, Model: VC 9808). The copper electrode was used to measure the resistance of the pellet.
The specific Sensitivity of the sensor is defined as the change in resistance (ΔR) of the sensing element per unit change in relative humidity (RH %) per unit resistance, i.e.
ΔS = ΔR/ R (Δ RH %) (1)
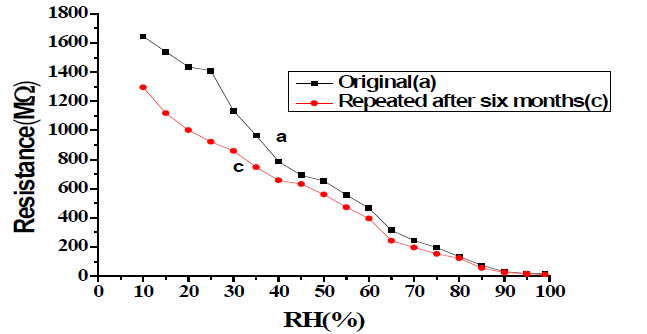
After studying humidity-sensing properties, sensing elements were kept in the laboratory environment, and their humidity-sensing characteristics were regularly monitored. The effect of aging on the sensing properties of these elements was examined again in the humidity chamber after six months of fabrication of the pellet for the stability analysis of the sensor [2].
Study of Surface morphology
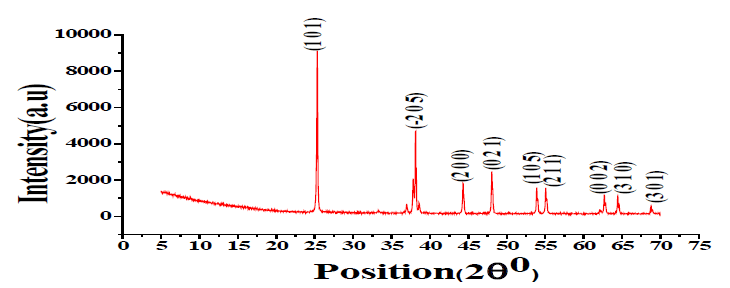
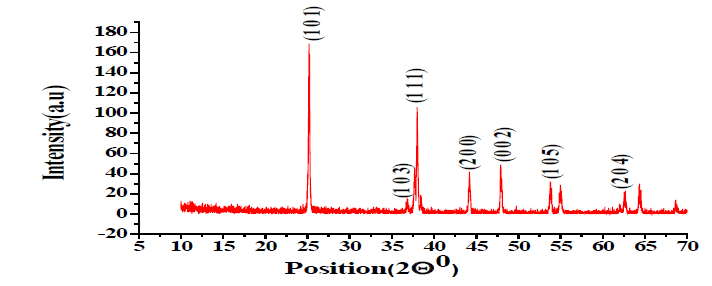
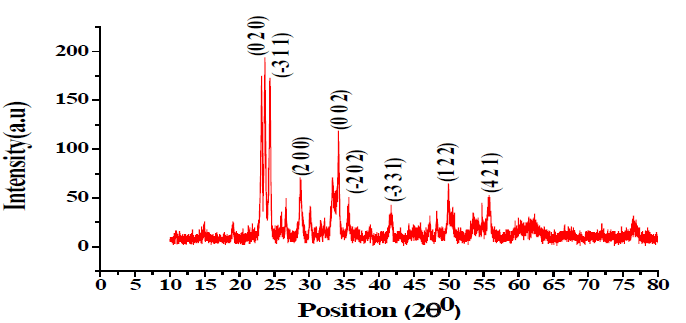
XRD Study of Ag-doped TiO2: The XRD pattern of Ag-doped TiO2 annealed at 500ºC, 600ºC, and 700ºC is shown in FIG. 1-3. X-ray Diffraction by X-Pert PRO XRD system (Netherland) shows the extent of crystallization of the sensing element as shown in TABLE 1.
Table1: XRD Study of Ag doped TiO2
| Ag doped TiO2 annealed at 500ºC | Ag doped TiO2 annealed at 600ºC | Ag doped TiO2 annealed at 700ºC | |||
|---|---|---|---|---|---|
| Average crystallite size is 116 nm | Average crystallite size is 108 nm | Average crystallite size is 119 nm | |||
| 2θ values | Corresponding Miller Planes | 2θ values | Corresponding Miller Planes | 2θ values | Corresponding Miller Planes |
| 25.28º 36.88º 38.09º 44.23º 47.85º 49.88º 54.86º 62.66º |
(101) (103) (111) (200) (002) (020) (105) (204) |
25.38º 37.04º 38.19º 44.41º 48.05º 53.99º 55.14º 62.78º |
(101) (-205) (111) (200) (021) (105) (211) (002) |
25.71º 28.71º 34.10º 35.71º 41.74º 49.98º 54.64º 55.79º |
(101) (200) (002) (-202) (-331) (122) (131) (421) |
The average crystallite size has been calculated using the Debye-Scherer formula. The minimum crystallite size is 108 nm at 600ºC [3,4].
Scanning electron microscopy
Surface morphology was studied using Scanning Electron Microscope Unit (SEM, LEO-0430, Cambridge). SEM micrograph shows that grains are of nano-size and the surface is porous in nature. These pores are expected to provide sites for humidity adsorption. The structure favors the adsorption and condensation of water vapors. The surface morphology of sensing elements TA-20 annealed at 700ºC was studied. The grain size of sensing element TA-20 annealed at 700°C is found to be 98 nm. It shows uniform distribution of particles having an approximately rounded shape [5,6].
Fourier Transform Infrared Spectroscopy (FTIR)
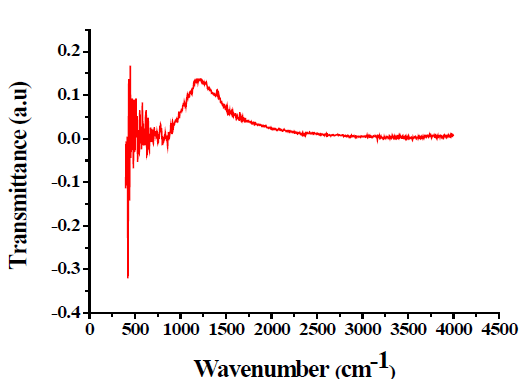
FTIR spectra were recorded by KBr disc on Tensor-27 Spectrum. IR spectroscopy was used for understanding the nature of organics present in the final products. FTIR absorption peaks shown in FIG. 4 for the samples show positive agreement when compared with data in infrared spectra of inorganic compounds [7,8]. The peaks of pure TiO2 were observed at 609 cm-1, 1130 cm-1, and 1409 cm-1 whereas the peaks of TiO2-Ag were 1335 cm-1 and 2360 cm-1.
Result and Discussion
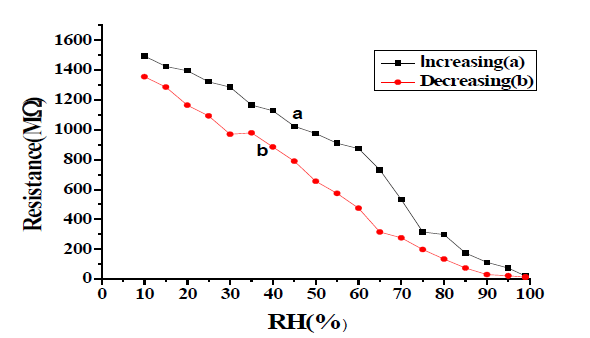
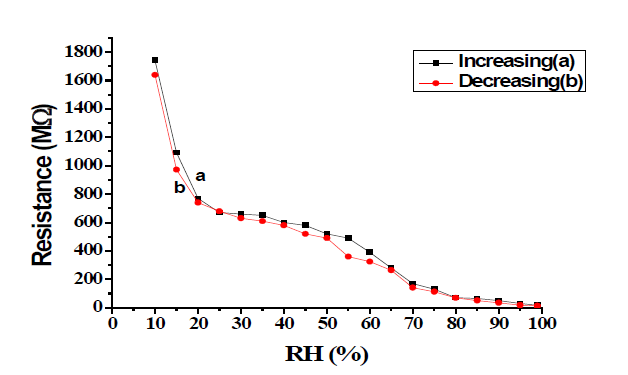
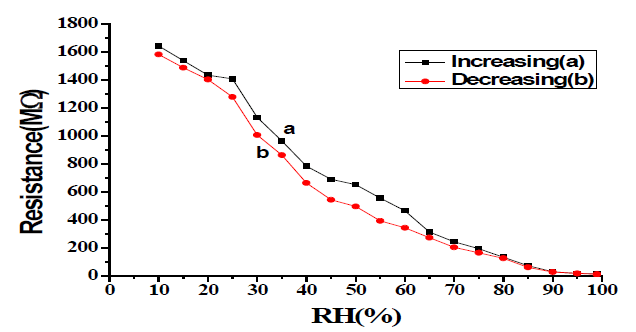
Resistance of the sample pellet T-20 has been measured after each time of annealing during controlled exposure to humidity in the range of 5% to 95%. Variation of resistance with a change in relative humidity at temperatures 500°C, 600°C, and 700°C of sample T-20 in FIG. 5-8 [9-12].
Conclusion
As the Fermi levels of these noble metals are lower than that of TiO2, photo-excited electrons can be transferred from the conduction band to the metal particles deposited on the surface of TiO2, while photo-generated valence holes remain in the TiO2. These activities greatly reduce the possibility of electron-hole recombination, resulting in efficient separation and stronger photo-catalytic reactions.
REFERENCES
- Kulwicki BM. Humidity sensors. J Am Ceram Soc. 1991; 74(4):697-708.
- Mistry KK, Saha D, Sengupta K. Sol–gel processed Al2O3 thick film template as sensitive capacitive trace moisture sensor. Sens Actuators B: Chem. 2005; 106(1): 258-62.
- Kummer AM, Hierlemann A. Configurable electrodes for capacitive-type sensors and chemical sensors. IEEE Sens J. 2006; 6(1):3-10.
- Bayhan M, Hashemi T, Brinkman AW. Sintering and humidity-sensitive behaviour of the ZnCr2O4–K22CrO4 ceramic system. Journal of Materials Science. 1997; 32:6619-23.
- Traversa E. Ceramic sensors for humidity detection: the state-of-the-art and future developments. Sens Actuators B Chem. 1995;23(2-3):135-56.
- Yeh YC, Tseng TY, Chang DA. Electrical properties of TiO2?K2Ti6O13 porous ceramic humidity sensor. J Am Ceram. Soc. 1990;73(7):1992-8.
- Wu L, Wu CC, Wu MM. Humidity sensitivity of Sr (Sn, Ti) O 3 ceramics. Journal of electronic materials. 1990;19:197-200.
- Nitta T, Terada Z, Hayakawa S. Humidity?Sensitive Electrical Conduction of MgCr2O4?TiO2 Porous Ceramics. J Am Ceram. Soc. 1980; 63(5?6):295-300.
- Chachulski B, Gebicki J, Jasinski G, et al. Properties of a polyethyleneimine-based sensor for measuring medium and high relative humidity. Meas Sci Technol. 2005; 17(1):12.
- Yadav BC, Pandey NK, Srivastava AK, et al. Optical humidity sensors based on titania films fabricated by sol–gel and thermal evaporation methods. Meas Sci Technol. 2006; 18(1):260.
- Pandey NK, Tripathi A, Tiwari K, et al. Morphological and humidity sensing studies of WO3 mixed with ZnO and TiO2 powders. Sensors and Transducers. 2008; 96(9):42-6.
- Parvatikar N, Jain S, Khasim S, et al. Electrical and humidity sensing properties of polyaniline/WO3 composites. Sens Actuators B Chem. 2006; 114(2):599-603.
