Original Article
, Volume: 12( 1)Prediction of Solubility of Racemic (R/S) (ñ)-Ibuprofen in n-Heptane, Toluene, Benzene and Ethanol
- *Correspondence:
- Ghader S , Department of Chemical Engineering, College of Engineering, Shahid Bahonar University of Kerman, Jomhoori Blvd., Kerman, Iran, Tel/Fax: +983432118298; E-mail: sattarghader@yahoo.com; ghader@uk.ac.ir
Received: April 19, 2017; Accepted: May 12, 2017; Published: June 28, 2017
Citation: Bagheri H, Ghader S, Hatami N. Prediction of Solubility of Racemic (R/S) (±)-Ibuprofen in n-Heptane, Toluene, Benzene and Ethanol. Chem Technol Ind J. 2017;12(1):112
Abstract
The solubility of racemic (R/S) (±)-ibuprofen in pure solvents: n-heptane, toluene, benzene and ethanol at range 15°C to 60°C using the regular-solution theory, the UNIFAC model and the UNIQUAC model is predicted and compared with the corresponding experimental values reported in previous study. The results of the ideal solubility show that is negligible in comparison to the molar enthalpy of fusion. There is a good agreement between the experimental solubility data of racemic (R/S) (±)-ibuprofen and the results of UNIQUAC model.
Keywords
Racemic (R/S) (±)-ibuprofen; Solubility; Activity coefficient; UNIQUAC; UNIFAC; Regular-solution theory
Introduction
A racemic compound of species is indicated as a mixture of two enantiomers by 50:50 ratio, and can exist as a racemic conglomerate, a racemic compound, or a solid solution (pseudoracemate) [1]. The definition in enantiomers, if a plane of polarized light is passed through any enantiomer and the light to the counterclockwise as levorotatory or (-)-enantiomer or R-form; on the contrary, the light to the clockwise as dextrorotatory or (+)-enantiomer or S-form [2]. Opposite enantiomers have identical physical and chemical properties such as molecular weight, solubility, melting point, and they only difference is their three-dimensional spatial arrangement. Racemic compound of ibuprofen, (R/S) (±)-ibuprofen 2-[4-isobutylphenyl] propionic acid, is a non-steroidal anti-inflammatory drug. It is most often prescribed to treat menstrual symptoms, pain, arthritis and fever. Racemic ibuprofen is a relatively weak acid compound [3], and it is water insoluble compound. The chemical formula of racemic ibuprofen is C3H18O2 and the structure of racemic (R/S) (±)-ibuprofen is shown in Figure. 1.

Figure 1: Structure of racemic (R/S) (±)-ibuprofen [1].
Solubility is the most basic information in a crystallization process. Crystallization process is a key unit operation in the production of pharmaceutical solids and fine chemicals, which has a major effect on drug quality in terms of crystal size distribution. It is evident that the solubility prediction is necessary in solvent selection and control of crystallization processes where the experimental data are scarce. One of the popular methods to predict solubility is based on the activity coefficient evaluation.
In the present study, four assumption applied for the ideal solubility of racemic ibuprofen are investigated; the solubility of racemic (R/S) (±)-ibuprofen in n-heptane, toluene, benzene and ethanol is predicted using the different models (regularsolution theory, the UNIFAC and the UNIQUAC model) and then compared with the corresponding experimental data reported in thesis [1].
Experimental Theory
At equilibrium [4]:
 (1)
(1)
Where  and
and  are the fugacities of pure solid and of solute in the solution, respectively. Using the sub-cooled liquid at temperature T and
  as the standard state for activity coefficient ( γ2) and assuming no solubility of solvent in solid
can be written:
 (2)
(2)
Where x2 is the solubility of solid in liquid in mole fraction and  is the fugacity of the pure sub-cooled liquid state of the solid. Thus
 (3)
(3)
The fugacity ratio is independent of the solvent properties and can be related to the molar Gibbs energy changes ( Δg ) of the solid.
 (4)
(4)
The ratio of  is called activity ( a2 ) and the molar Gibbs energy changes can also be related to the molar enthalpy ( Δh ) and entropy ( Δs) changes.
ln 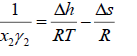 (5)
(5)
Where R is the universal gas constant. Since both enthalpy and entropy are state functions (no path functions), they can be evaluated from any thermodynamic path. Using triple point of solid, Prausnitz et al. [4] applied a thermodynamic cycle to evaluate the enthalpy and entropy changes [5].
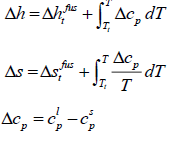 (6)
(6)
where  is the molar enthalpy of fusion at triple point, is the molar entropy of fusion at triple point Tt is the triple point temperature, which can be considered as the melting point,
  and
and  are the heat capacities of solute in liquid and solid states. Thus,
 (7)
(7)
where the index m shows all properties at melting point. The enthalpy of fusion is also related to entropy of fusion.
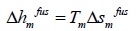
thus:
 (8)
(8)
The measured solubility is often in terms of g of solute per 100 g of solvent (shown by S). To convert the solubility in terms of mole fraction ( x2) to this unit, we have to use the following equations:
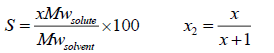 (9)
(9)
Mw is the molecular weight, g/mole. The ideal and experimental mole fractions are related by:
 (10)
(10)
Prediction of the actual solubility requires the actual activity coefficient of the solute in the solution, γ2 , which should be calculated from the thermodynamic models.
Ideal solubility
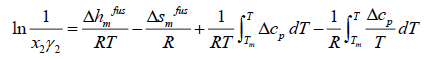
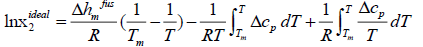
Assuming ideal solution, the activity coefficient of solute in the solution is equal to unity, and the general equation of ideal solubility can be written as [5]:
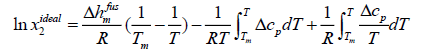 (11)
(11)
Eqn. (11) calculates the ideal mole fraction of solute in an ideal solution using the thermal properties of the solid phase. Because limited data are available in the literature to calculate Δcp , some assumptions are applied to eqn. (11) to estimate the ideal solubility.
Case A: In most chemical engineering applications, the first term of the right-hand side of eqn. (11) is the dominant one, and the next two terms with two opposite signs tend to cancel each other.
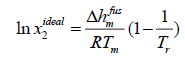 (12)
(12)
Where Tr is the ratio of melting temperature to solution temperature  .
.
Case B: Assumption Δcp=0 is a good approximation to solve eqn. (11).
 (13)
(13)
Eqn. (13) has been applied to pharmaceuticals [5] and has resulted in better approximations.
Case C: To estimate the ideal solubility more accurately, eqn. (11) can be simplified if the differential molar heat capacity is assumed to be constant and estimated at the melting point.
 (14)
(14)
Case D: If Δcp is not constant, eqn. (11) has to be integrated with respect to differential molar heat capacity changes. In case of linear changes Δcp in temperature for ibuprofen, eqn. (11) can be rewritten as:
Δcp= b +mT
 (15)
(15)
Results and Discussion
Thermodynamic models (Hildebrand, the UNIFAC and the UNIQUAC models) were used to predict the activity coefficient and solubility of racemic ibuprofen in different pure solvents: n-heptane, toluene, benzene and ethanol. The activity coefficient is a function of many factors such as molecular size, polarity and interaction forces between solute and solvent.
Thermodynamic models to predict the activity coefficient can be categorized in theoretical and semi-empirical models. The theoretical models have no adjustable parameters and use the thermodynamic bulk properties (regular-solution theory) or group contribution of the solute and solvent (UNIFAC), and the semi-empirical models (UNIQUAC) need experimental data to estimate adjustable parameters to predict the activity coefficient.
The optimization procedure was based on the minimization of the error between the calculated and experimental values of the activity coefficients:
MinError= (16)
(16)
Where  and
and  are the experimental and calculated activity coefficients of racemic (R/S) (±)-ibuprofen, respectively. To predict the mole fraction of solute in the solvent, an iterative procedure was performed:
1. Calculate the ideal mole fractions from eqns. (12-15) at temperatures that the solubility of solids is available.
2. Calculate the experimental activity coefficient from eqn. (10).
3. Calculate the corresponding activity coefficient from the thermodynamic models (Hildebrand, the UNIFAC and the UNIQUAC models).
4. Write a regression program in Excel that program changes the adjustable parameters of the UNIQUAC model to minimize the error in eqn. (16).
In order to predict of activity coefficient, the thermal properties of racemic (R/S) (±)-ibuprofen are needed. A scanning calorimeter method was used to measure the heat of fusion and melting temperature [1]. So, the values heat of fusion and melting temperature of racemic ibuprofen are 25.5 kJ/mol and 77°C, respectively [6]. Figure. 2 shows liquid and solid molar heat capacities of racemic compound of ibuprofen [7]; according to the data, the differential molar heat capacity is calculated:
Δcp= 45.2916 0.0712 T (17)

Figure 2: The heat capacities of racemic ibuprofen [7].
Experimental data of solubility of racemic (R/S) (±)-ibuprofen in different solvents at the range of 15°C to 60°C are illustrated in Table 1 [1].
| Solvent | Temperature (°C) | |||
|---|---|---|---|---|
| 15 | 25 | 40 | 60 | |
| n-Heptane | 2.95 | 3.41 | 103 | 745 |
| Toluene | 316 | 448 | 742 | 1970 |
| Benzene | 361 | 496 | 884 | 1430 |
| Ethanol | 500 | 808 | 943 | 1300 |
Table 1: Experimental data [1] of solubility (per mg/ml) of racemic (R/S) (±)-ibuprofen in different solvents: n-heptane, toluene, benzene and ethanol.
Ideal solubility of racemic (R/S) (±)-ibuprofen
Using thermal properties of racemic (R/S) (±)-ibuprofen and eqns. (12-15), the ideal solubility of racemic (R/S) (±)-ibuprofen at temperature range are obtained in Table 2.
| from cases | ||||
| T (°C) | A | B | C | D |
| 15 | 0.1563 | 0.1857 | 0.1844 | 0.1837 |
| 25 | 0.2234 | 0.2506 | 0.2494 | 0.2489 |
| 40 | 0.3656 | 0.3857 | 0.3849 | 0.3847 |
| 60 | 0.6583 | 0.6647 | 0.6644 | 0.6644 |
Table 2: Ideal solubility of racemic (R/S) (±)-ibuprofen.
Prediction of real solubility of racemic (R/S) (±)-ibuprofen
Regular-Solution Theory (Scatchard-Hildebrand theory) assumes that the excess entropy and volume changes are zero during the mixing of components. The Regular-solution equations always predict γi ≥1 ; i.e., a regular solution can exhibit only positive deviations from Raoult’s law. Regular-solution theory shows that for a binary solution of nonpolar molecules, the solute activity coefficient can be expressed by:
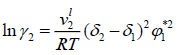 (18)
(18)
Where is a volume fraction of solvent, defined by:
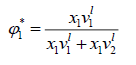 (19)
(19)
 and
and  are the molar volume and solubility parameter of components, respectively. Solubility parameter are function of temperature, but the difference between these solubility parameters,
 , is often nearly independent of temperature [4]. The molar volume of racemic (R/S) (±) -ibuprofen is 185.8378 cm3 mol-1, which is calculated from
 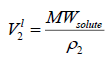 using
using 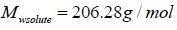 and
and 
[1]. The solubility parameter of racemic ibuprofen, 16.44 (J cm-3)0.5 [8].
The UNIQUAC activity coefficient model is semi-empirical model based on two adjustable parameters [4]:
 (20)
(20)
where
 (21)
(21)
 (22)
(22)
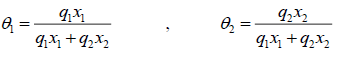
where the coordination number Z is set to equal 10. Segment fraction, φ , and area fractions, θ , and θ1 , are given by
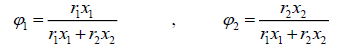 (23)
(23)
 (24)
(24)
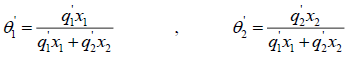 (25)
(25)
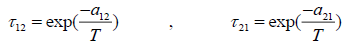
Parameter r, q and q' are pure-component molecular-structure constants depending on molecular size and external surface areas. Basically, q' is equal to q, but for alcohols it differs. a12 and a21 are the adjustable parameters of UNIQUAC activity coefficient model. The adjustable parameters can be used in simulation software for predicting other properties of the employed chemicals or for predicting the equilibrium in multi-component systems.
The UNIFAC activity coefficient model is separated into two parts: one part provides the contribution due to differences in molecular size and shape (combinational part), and the other provides the contribution due to molecular interactions (residual part) [9]:
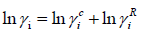 (26)
(26)
where
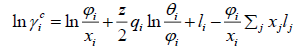 (27)
(27)
 (28)
(28)
For cases that the van der Waals area and volume are not available, the functional group approach is used.
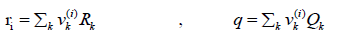 (29)
(29)
Where k is the number of functional groups in the molecule, which is 6 for racemic ibuprofen and vk(i ) is the repeating number of each functional group in the solute or solvent molecule. Rk and Qk are group volume and area [9]. The functional groups and group volume and area of racemic ibuprofen are given in Table 3.
| R | Q | Number of groups in the molecular (ν) | |
|---|---|---|---|
| CH3 | 0.9011 | 0.848 | 3 |
| CH2 | 0.6744 | 0.54 | 1 |
| CH | 0.4469 | 0.228 | 2 |
| ACH | 0.5313 | 0.4 | 4 |
| AC | 0.3652 | 0.12 | 2 |
| COOH | 1.3013 | 1.224 | 1 |
Table 3: Functional groups and the group volume and area parameter of racemic ibuprofen.
Using this table and eqn. (26), the numerical values of r and q for racemic (R/S) (±)-ibuprofen were calculated equal to 8.429 and 6.604, respectively.
n-heptane has two functional groups, CH3 and CH2; toluene has three main functional groups, CH3, ACH and AC; benzene has only one functional group, ACH; finally, main functional groups of ethanol are CH3, CH2 and OH. The main group and sub-group numbers along with the properties of specified functional groups, together with the values of group interaction parameters (amn ) were adapted from literatures [9].
The residual part of the activity coefficient, eqn. (28), is replaced by the solution-of-groups concept.
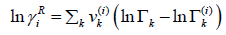 (30)
(30)
Where  is the group residual activity coefficient and
  is the residual activity coefficient of group k in a reference solution containing only molecules of type i.
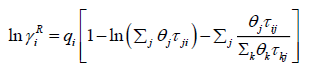
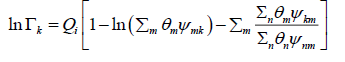 (31)
(31)
θm is the area fraction of group m, and the sums are over all different groups.θm is calculated in a manner similar to that for θi :
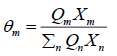 (32)
(32)
Where Xm is the mole fraction of group m in the mixture. The group-interaction parameter ψmn is given by:
 (33)
(33)
The group interaction parameters amn must be evaluated from experimental phase equilibrium data. Note that amn has units of kelvins and amn ≠ amn .
In order to choose the best predictive model for ideal solubility of racemic (R/S) (±)-ibuprofen in different solvents, all models are compared by the summation of absolute errors between the experimental and the calculated solubility using regular-solution theory, UNIFAC and UNIQUAC models (in mole fraction) defined by:
 (34)
(34)
Table 4 is obtained absolute errors for all activity models (Regular-solution theory, UNIFAC and UNIQUAC models) in different pure solvents: n-heptane, toluene, benzene and ethanol at temperature range 15°C to 60°C.
| Regular-solution | UNIQUAC | UNIFAC | ||||||||||
|---|---|---|---|---|---|---|---|---|---|---|---|---|
| Solvent | Case A | Case B | Case C | Case D | Case A ×105 | Case B ×105 |
Case C ×105 | Case D ×105 | Case A | Case B | Case C | Case D |
| n-Heptane | 1.399 | 1.481 | 1.478 | 1.477 | 5.436 | 5.508 | 5.505 | 5.504 | 0.319 | 0.336 | 0.335 | 0.335 |
| Benzene | 0.597 | 0.631 | 0.630 | 0.630 | 0.867 | 1.461 | 1.433 | 1.418 | 1.356 | 1.430 | 1.427 | 1.426 |
| Toluene | 0.782 | 0.826 | 0.824 | 0.824 | 2.043 | 1.356 | 1.364 | 1.370 | 0.990 | 1.045 | 1.043 | 1.042 |
| Ethanol | 0.31×10⁻³ | 0.32×10⁻³ | 0.32×10⁻³ | 0.32×10⁻³ | 8.119 | 8.781 | 8.756 | 8.746 | 0.754 | 0.803 | 0.801 | 0.800 |
Table 4: Comparison of errors due to solubility prediction of regular-solution theory, UNIQUAC and UNIFAC.
It is apparent that in all activity coefficient models, case A is better than other cases for racemic ibuprofen. So, ideal solubility of racemic ibuprofen is calculated by case A.
Table 5 shows adjustable parameters of UNIQUAC for case A that were calculated from minimization the error in eqn. 16. The reported errors in this table are the absolute deviation between the calculated solubility using UNIQUAC and the experimental data:
 (35)
(35)
| Solvent | T range (°C) | r | q | q? | a12 | a21 | %error |
|---|---|---|---|---|---|---|---|
| n-Heptane | 15-60 | 5.17 | 4.40 | 4.40 | 604.96 | -6.60 | 63.82 |
| Toluene | 15-60 | 3.92 | 2.97 | 2.97 | 1016.36 | -323.81 | 13.15 |
| Benzene | 15-60 | 3.19 | 2.40 | 2.40 | 1158.08 | -363.27 | 5.22 |
| Ethanol | 15-60 | 2.11 | 1.97 | 0.92 | 1382.84 | -415.90 | 11.28 |
Table 5: .Adjustable parameters of UNIQUAC; subscript 1 refer to solvents and 2 refer to racemic (R/S) (±)-ibuprofen.
Figure. 3 depicts the comparison between experimental and calculated solubility of racemic (R/S) (±)-ibuprofen in different pure solvents: n-heptane, toluene, benzene and ethanol, respectively.

Figure 3: The comparison between experimental solubility of racemic (R/S) (±)-ibuprofen and theoretical solubility by using the regular-solution theory, UNIQUAC and UNIFAC models in (a) n-heptane (b) toluene (c) benzene (d) ethanol.
UNIQUAC model have best prediction compared with the regular-solution theory and UNIFAC model, in all solvents. Regular-solution theory cannot be considered as a suitable predictive model; in all solvents this model has a large error except Ethanol solution. It is apparent that for non-polar binary mixtures, regular-solution theory is good model. However, regular-solution theory usually provides an easy way for approximation of solubility and activity coefficient by using the bulk properties of solute. It was found that as the polarity of solvent increases the solubility of racemic compound of ibuprofen also increases:
Solubility: n-heptane<toluene<benzene<ethanol
Polarity: n-heptane<toluene<benzene<ethanol
Conclusion
Ideal solubility of the racemic ibuprofen was calculated using four cases. The results show that the Δcp=0 assumption in case A is best assumption for estimation racemic ibuprofen solubility and activity coefficient. Assuming linear changes Δcp with temperature (case D) in better estimation that cases B and C, because working temperature range are near the melting point. The UNIQUAC activity coefficient model with adjustable parameters is a better predictive model than the other models (regular-solution theory, UNIFAC).
References
- Chen YH, Lee T. Initial solvent-screening of racemic (R/S) (±)-ibuprofen and crystallization kinetics of ibuprofen sodium salts, National Central University. 1996.
- Gohel MC. Overview on chirality and applications of stereo-selective dissolution testing in the formulation and development work. Dissolution Tech. 2003;10:16.
- Potthast H, Dressman JB, Junginger HE, et al. Biowaiver monographs for immediate release solid oral dosage forms: Ibuprofen. J Pharm Sci. 2005;94:2121.
- Prausnitz JM, Lichtenthaler RN, De Azevedo EG. Molecular thermodynamics of fluid-phase equilibria, 3rd ed.Prentice Hall: New Jersey (1999).
- Hojjati H, Rohani S. Measurement and prediction of solubility of paracetamol in water-isopropanol solution. Org Process Res Dev. 2006;10:1110.
- Pacheco DP, Manrique YJ, Martinez F. Thermodynamic study of the solubility of ibuprofen and naproxen in some ethanol+ propylene glycol mixtures. Fluid Phase Equilibr. 2007;262:23.
- FXu, L Sun, Z Tan, et al. ActaPhysChim Sin. 2005;21:1.
- Jouyban. Handbook of solubility data for pharmaceuticals. CRC Press Taylor & Francis Group,USA. 2010.
- Poling E, Prausnitz JM, PO?ConnellJ. The properties of gases and liquids,5th ed. McGraw-Hill, New York, USA. 2004.