Original Article
, Volume: 15( 4)Optimization Central Composite Design for the Simultaneous Determination of Copper in Fruit and Vegetable Samples with Adsorptive Stripping Voltammetry in the Presence of Calcein
- *Correspondence:
- Deswati S, Department of Chemistry, Faculty of Mathematics and Natural Science, Andalas University, Kampus Limau Manis, Padang, Indonesia, Tel:+62-751-462193; E-mail: deswati_ua@yahoo.co.id
Received: July 25, 2017; Accepted: September 25, 2017; Published: September 30, 2017
Citation: Deswati S, Suyani H, Rahmi I, et al. Optimization Central Composite Design for the Simultaneous Determination of Copper in Fruit and Vegetable Samples with Adsorptive Stripping Voltammetry in the Presence of Calcein. Int J Chem Sci. 2017;15(4):204
Abstract
The purpose of this study was to optimize the simultaneous determination of trace copper by adsorptive stripping voltammetry in the presence calcein as a complexing agent. The independent factors that affect the response were calcein concentration. pH, potential accumulation and time accumulation. The research design was used a central composite design (CCD) with 4 variables. 5 level and 31 a combination of treatments. The first step of 2k factorial design optimization is: to give the highest level of code values (+1.68). the lowest level (-1.68) and code (0) as the center point. Programs that will be used for statistical data processing, namely Minitab 17 using CCD. Based on data analysis with response surface method, the obtained optimum conditions for the simultaneous determination of copper is calcein concentration 0.11 mM, pH 6.8, potential accumulation -0.88 V and time accumulation 42.34 s. The linear calibration graph for the concentration (0.2 -110.0) μg/L, with detection limits 1.79 μg/L. This procedure was successfully applied for the determination of in the fruit and vegetable samples with satisfactory results.
Keywords
Simultaneous determination; Copper; Adsorptive stripping voltammetry; Central composite design; Fruit and vegetable samples
Introduction
Some of the elements included in the category of heavy metals such as As, Cr, Cd, Pb, Fe, Cu, Co, Hg, Se, Sb, Mn, Zn and Ni come from industrial waste and the results of the activity of the population. Copper is essential for living organisms at only trace amounts, but when it exceeds the prescribed limit, it has also a detrimental effect on human health. Exposure to excessive levels of copper can result in a number of adverse health effects including liver and kidney damage, anemia, immunotoxicity and developmental toxicity [1]. Therefore, due to applications of this element in chemical industry it is very important to be able to determine of trace copper in fruit and vegetable samples with highly sensitivity and selectivity. If it enters into the human body has a tendency to congregate in organs. could not get out again through the digestive process. Water, land and air are the medium that can be used for the deployment of heavy metals into the environment. Broad-leafed plants, in addition, to absorb heavy metals from the soil can absorb heavy metals from the air.
The previous studies. it has been reported by various researchers in the world, some determination of Cu and Cd acid dithiosalisilate 2.2 [2], the simultaneous determination of Pb and Cd with morin [3], the simultaneous determination of Cu and Cd ultra-trace levels in food samples and water types complexing agent were used for the analysis of the determination of metal ions either individually or simultaneously with adsorptive stripping voltammetry. Simultaneous with luminol [4], the simultaneous determination of Cu, Pb, Cd and Zn using murexide as a chelating agent [5], the simultaneous determination of Cd, Cu and Pb with calcon [6], the simultaneous determination of Pb and Cd at the level of a trace in natural waters with pyrogallol red [7], the simultaneous determination of Cu, Pb, Cd, Ni, Co and Zn in samples of bioethanol fuel with a mixture of several as a complexing agent by AdSV and regression multi-variant [8] and the simultaneous determination of Pb, Cd and Zn using clioquinol as a complexing [9], the simultaneous determination of Cd, Cu, Pb and Zn using calcein [10] and the simultaneous determination of Cu, Pb and Cd [11]. The determination is very sensitive to a number of trace Cu in food samples with 1.10 fenantrolin by adsorptive stripping voltammetry [12] and the determination of Cu in the ultra-trace levels in food samples with thiosemicarbazide [4].
AdSV was selected as an alternative method because it has many advantages such as high salinity of the sea water does not interfere with the analysis, high sensitivity, detection limit low on the scale ug/L (ppb), simple sample preparation, rapid analysis, low infrastructure cost [13-20]. In addition. with this method, it is possible to learn chemical species of heavy metals [21,22], which cannot be done with other methods. From the results of previous research, to find the optimization the determination of metal ions Cd, Cu, Pb and Zn [6,14] and metal ions Fe, Co, Ni and Cr17 either in the form of single or simultaneous AdSV, carried out by observing the effect of one variable is changed, while the other variables are kept at a constant level. This optimization technique is called optimization of the variables or the factors at the current time.
The main drawback of the results of the optimization of the factors that such optimization does not take into account the effect of the interaction between the variables studied. Therefore. this technique does not describe the full effect on the response parameter [23]. Another disadvantage of the optimization of the factors is the increased number of trials required to do research. which leads to increased time and increased consumption of reagents and materials. To overcome this problem. a technique of optimization of analytical procedures is by using multivariate statistical techniques. Calcein was selected as a sensitive and selective as a complexing agent has been reported by Marcin and Golimowski [24] on the determination of Ti. but calcein used in the determination of Cu with optimization central composite design has not been reported.
AdSV is a highly sensitive technique, the response obtained in the form of the peak current (Ip) was influenced by variables the following, namely: the effect variations of calcein concentration, pH, potential accumulation and, the time accumulation [5-6,11,13-18]. Therefore, it is very important to determine the optimization of these parameters, which will affect the measurement of the peak current in order to improve the quality of analytical results [25]. The research design was used in this study. as a tool for optimization was: CCD with 4 is coding. where the value of the highest level (+1.68). the lowest level (-1.68) and code (0) as the center point. variables. 5 level/degree and 19 a combination of treatments. The first step of 2k factorial design optimization Programs for statistical data processing Minitab 17 by using RSM (Response Surface Methodology).
The use of RSM has been reported by Yilmaz et al. [26] in the determination of Al content in salt samples using calcon as a complexing agent in AdSV. Furthermore Paolicchi et al. [25] have used the experimental design in the form of CCD optimization for determination of In (III) in the AdSV using pyrrolidine ammonium dithiocarbamates (APDC) as a complexing agent [26]. Danielle et al. [8] have reported the simultaneous determination of Cu, Pb, Cd, Ni, Co and Zn in the AdSV using multivariant regression aided optimization techniques with projection algorithm (SPA-MLR). Espada-Bellido [27] have used multivariant analysis for optimization determination of lead in the water AdSV at nanomolar levels based on the formation of metal complexes with 2-asetilpiridin salicyl hydrazone (2-APS). Deswati et al. [28] has been using CCD for the determination of cadmium in seawater using calcon by adsorptive stripping voltammetry and optimization determination and Zn in water samples. Furthermore, Deswati et al. [29] have reported CCD for optimization of a lead with calcon as a complexing agent by adsorptive stripping voltammetry.
The purpose of this study was to obtain the optimum condition of the heavy metal ion Cu. so can be applied to the analysis of these metals in samples of fruits. To achieve these objectives. required an optimization technique that was using the analytical procedure RSM with CCD [28-32]. To determine the accuracy, precision and sensitivity of the method are determined relative standard deviation (SDR), recovery and the limit of detection and the linearity of the proposed method.
Experimental Details
Equipment and materials research
The tools were used in this study were 797 Metrohm Computrace with HMDE working electrode, reference electrode such as Ag/AgCl/KCl, a Pt electrode as a supporting electrode, pH meter 80 models Griffin. Griffin and George Loughborough, England and analytical balance Mettler AE 200, Toledo OH-USA and glassware used in the laboratory.
Work procedures
Voltammeter into the vessel put 10 ml of standard solution of Cu (II) 10 μg/L. added 0.2 mL and 0.2 mL of 0.1 M KCl calcein in 20 ml. this variable is set constant during the experiment. The concentration of calcein. pH. accumulation potential and accumulation time are set according to the experimental design of the CCD in Table 1 below. From Table 1 is obtained peak current response in the form of metal ions Cu.
| Exp | Factor | Respon (Ip) |
|||
|---|---|---|---|---|---|
| Calcein concentration (mM) | pH | Potential (V) |
Time (s) |
||
| 1 | 0.1 | 6 | -1.0 | 30 | 288.67 |
| 2 | 0.1 | 6 | -0.8 | 30 | 289.30 |
| 3 | 0.1 | 6 | -1.0 | 70 | 304.30 |
| 4 | 0.1 | 6 | -0.8 | 70 | 318.07 |
| 5 | 0.1 | 8 | -1.0 | 30 | 340.83 |
| 6 | 0.1 | 8 | -0.8 | 30 | 349.40 |
| 7 | 0.1 | 8 | -1.0 | 70 | 155.48 |
| 8 | 0.1 | 8 | -0.8 | 70 | 152.32 |
| 9 | 0.3 | 6 | -1.0 | 30 | 105.23 |
| 10 | 0.3 | 6 | -0.8 | 30 | 120.92 |
| 11 | 0.3 | 6 | -1.0 | 70 | 147.02 |
| 12 | 0.3 | 6 | -0.8 | 70 | 152.42 |
| 13 | 0.3 | 8 | -1.0 | 30 | 235.45 |
| 14 | 0.3 | 8 | -0.8 | 30 | 228.63 |
| 15 | 0.3 | 8 | -1.0 | 70 | 371.66 |
| 16 | 0.3 | 8 | -0.8 | 70 | 256.74 |
| 17 | 0.2 | 7 | -0.9 | 50 | 365.33 |
| 18 | 0.2 | 7 | -0.9 | 50 | 365.40 |
| 19 | 0.2 | 7 | -0.9 | 50 | 366.05 |
| 20 | 0.2 | 7 | -0.9 | 50 | 366.30 |
| 21 | 0.2 | 7 | -0.9 | 50 | 365.20 |
| 22 | 0.2 | 7 | -0.9 | 50 | 361.74 |
| 23 | 0.2 | 7 | -0.9 | 50 | 361.45 |
| 24 | 0.04 | 7 | -0.9 | 50 | 289.45 |
| 25 | 0.2 | 5.4 | -0.9 | 50 | 227.51 |
| 26 | 0.2 | 7 | -1.06 | 50 | 245.17 |
| 27 | 0.2 | 7 | -0.9 | 18.1 | 212.28 |
| 28 | 0.36 | 7 | -0.9 | 50 | 243.76 |
| 29 | 0.2 | 8.6 | -0.9 | 50 | 300.23 |
| 30 | 0.2 | 7 | -0.74 | 50 | 312.72 |
| 31 | 0.2 | 7 | -0.9 | 81.9 | 311.31 |
Table 1: Design experiments RSM for simultaneous determination of trace copper.
Design of research
The design of the study was: CCD with RSM 4 factors and 5 levels of each factor is coded -1.68, 0 and +1.68 with 2 replications. Score -1.68, 0. And +1.68 is a symbol that indicates the value of the variable. Score -1.68 indicates the value of the lowest variable +1.68 figures show the highest variable values. and the number 0 indicates the value of the variable medium. Factors of the research design were the concentration of calcein. pH. accumulation potential and accumulation time. The statistical data processing program for the Minitab 17 using RSM.
Determination of sampling site and sample preparation
The sampling method is done by purposive sampling, which is done by taking into account the condition of the research area also the current and the depth of the research area. This is intended to see to what extent the concentration of pollutants spread. To know the content of heavy metals in sea water is done sampling in sea water taken around Bungus, water tap from research laboratory of Chemistry Department, lake water from Maninjau Lake and river water taken from Lubuk Minturun. Samples of water prior to analysis were preserved with 65% HNO3 with a ratio of 2: 1000 and filtered using Whatman 42 filter paper [30].
Vegetable samples used in this study are, cauliflower, mustard greens, eggplant and broccoli, while the fruits used include apples, banana kepok, melon and dragon fruit. Samples of vegetables and fruits before the determination of Zn metal content is determined first the water content, then do wet destruction with the addition of nitric acid pa and perchloric acid pa.
Each sample of 0.5000 g was carefully weighed and mashed, put into a Kestergum digestion flask. Further, the wet was destructed by the addition of 5 ml of concentrated nitric acid and 0.5 ml of concentrated perchloric acid, shaken and left overnight. Next, heated to the digestor block starting at 100°C, after the yellow vapor is exhausted the temperature is increased to 200°C. The destruction is terminated when the white vapor and liquid in the flask remain about 0.5 mL, cooled and diluted with doubly destilled water and the volume is adjusted to 50 mL, shaken until homogeneous and left overnight and disarrayed [31,32].
Clear solution is ready to be determined by Zn metal content with Voltammeter and Atomic Absorption Spectrophotometer as a comparison. The determination of the optimum conditions used in this study is the procedure developed by the previous research team [4, 7-9,11,12,17,18].
Detection method
The procedure of determining RSD (relative standard deviation), LOD (limit of detection), LR (linear range) and recovery has been done by previous researchers. The procedure of determining RSD (relative standard deviation), LOD (limit of detection), LR (linear range) and recovery has been done by previous researchers [4, 7-9,11,12,17,18].
Results, Discussion and Conclusion
Optimization of copper using one variable
The optimization by observing the effect of one variable in the determination of trace metal Cu in the presence of calcein has been done [1]. The optimum condition as follow: calcon concentration 0.7 mM, pH 7, accumulation potential -0.6 V, accumulation time 50s. At the optimum conditions, the relative standard deviation was obtained with 8 replicates (n=8) measurements standard solution Cu (II) 10 μg/L was 0.86%, respectively. This technique does not describe the full effect on the response parameters and optimization of these factors is the increase in the number of trials required to do research, which leads to increased time and increased consumption of reagents and materials. Therefore to overcome this problem, an optimization technique of analytical procedures is by using CCD.
Optimization CCD for simultaneous determination of copper
The first order model can not be used. then proceed with the second order model by adding a quadratic effect and interaction. The result of data processing obtained the following:
According on Table 2. the model obtained from the data analysis were:
| Term | Co-efficient |
|---|---|
| Constant | 362.610 |
| X1 | -30.342 |
| X2 | 22.480 |
| X3 | 1.513 |
| X4 | 3.054 |
| X1*X1 | -31.944 |
| X2*X2 | -32.908 |
| X3*X3 | -27.581 |
| X4*X4 | -33.643 |
| X1*X2 | 48.076 |
| X1*X3 | -7.529 |
| X1*X4 | 35.977 |
| X2*X3 | -9.489 |
| X2*X4 | -20.987 |
| X3*X4 | -7.311 |
Table 2: The regression coefficient on the second order model.
?=362.610–30.342 x1+22.480x2+1.513x3+3.054x4–31.944x12-32.908 x22–27.581 x32-33.643 x42+48.076 x1x2-7.529 x1x3+35.977x1x4-9.489 x2x3–20.987 x2x4-7.311 x3x4
whereas the results of analysis of variance experimental data can be seen in Table 3.
| Source | DF | Seq SS | Adj SS | Adj MS | F | P |
|---|---|---|---|---|---|---|
| Regression | 14 | 176846 | 176846 | 12631.8 | 6.62 | 0.000 |
| Liniar | 4 | 31136 | 31136 | 7783.9 | 4.08 | 0.018 |
| X1 | 1 | 19939 | 19939 | 19938.9 | 10.44 | 0.005 (S) |
| X2 | 1 | 10945 | 10945 | 10945.0 | 5.73 | 0.029 (S) |
| X3 | 1 | 50 | 50 | 49.6 | 0.03 | 0.874 |
| X4 | 1 | 202 | 202 | 202.0 | 0.11 | 0.749 |
| Square | 4 | 77769 | 77769 | 19442.3 | 10.18 | 0.000 |
| X1*X1 | 1 | 22839 | 17096 | 17096.3 | 8.95 | 0.009 |
| X2*X2 | 1 | 21698 | 18145 | 18144.9 | 9.50 | 0.007 |
| X3*X3 | 1 | 14268 | 12745 | 12745.1 | 6.68 | 0.020 |
| X4*X4 | 1 | 18964 | 18964 | 18964.0 | 9.93 | 0.006 |
| Interaction | 6 | 67941 | 67941 | 11323.5 | 5.93 | 0.002 |
| X1*X2 | 1 | 36981 | 36981 | 36980.9 | 19.37 | 0.000 (S) |
| X1*X3 | 1 | 907 | 907 | 906.9 | 0.47 | 0.501 |
| X1*X4 | 1 | 20710 | 20710 | 20709.8 | 10.85 | 0.005 (S) |
| X2*X3 | 1 | 1441 | 1441 | 1440.8 | 0.75 | 0.398 |
| X2*X4 | 1 | 7047 | 7047 | 7047.2 | 3.69 | 0.073 (S) |
| X3*X4 | 1 | 855 | 855 | 855.3 | 0.45 | 0.513 |
| Residu Error | 16 | 30547 | 30547 | 1909.2 | - | - |
| Lack-of-Fit | 10 | 30523 | 30523 | 3052.3 | 746.11 | 0.000 |
| Pure Error | 6 | 25 | 25 | 4.1 | - | 0.000 |
| Total | 30 | 207393 | - | - | - | - |
Table 3: Results of analysis of variance the second order model.
Based on Table 3 carried out the test procedures to second order model. This hypothesis test was used to test the truth of the regression model. the test if there is a free variable (including quadratic and interaction effects) significantly influence the response variable. The hypothesis being tested is H0: βi=0.
H1: ada βi≠0; i=1.2.3.….k
According on Table 3. the test regression parameters simultaneously produce a p-value of 0.000. meaning that the p-value obtained is smaller than the significance level used in the amount of α=0:05. Thus it was decided to reject H0 and conclude that the independent variable significant effect on the response variable. so that the second-order model is unacceptable (Table 4).
| Variable | Optimal value (with coding) | Optimal value (without coding) |
|---|---|---|
| X1 (Conc. calcein) | -0.876403 | 0.112360 |
| X2(pH) | -0.210201 | 6.78980 |
| X3 (Potential) | 0.233981 | -0.876602 |
| X4 (Time) | -0.383074 | 42.3385 |
Table 4: Results the optimum conditions of Cu with RSM.
Determination of stationary point
Based on the regression coefficients in Table 2 can be arranged matrix B and B as follows:
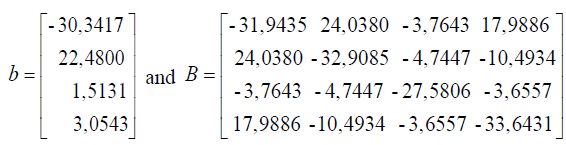
in order to obtain a stationary point as follows:
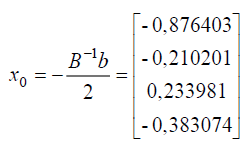
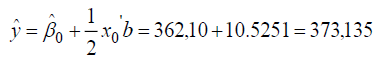
thus, the response to a stationary point solution is obtained as follows:
Furthermore, the stationary point can be restored to the true value, acquired conditions that provide the optimal solution is as follows:
Characteristics of response surface analysis
Furthermore, the stationary point can be restored to the true value, acquired conditions that provide the optimal solution is as follows:
To get an idea of the characteristics of the surface of the first response calculating eigenvalues (λ) of the matrix B and obtained:
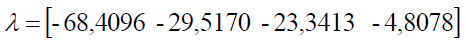
Fourth eigen values are negative, then the shape of the surface response is maximum. It can also be seen from the plot contour and response surface plot. By making constant two among the 4 factors were observed at a stationary point, then it may be possible to plot the contour and response surface as shown in Figures 1a-1e below.

Figure 1a: Countour and surface plot X3 and X4 in the stationary point. Countour plot and respon surface of peak current (Cu) on X1 dan X2.

Figure 1b: Countour and surface plot X2 and X4 in the stationary point. Countour plot and respon surface of peak current (Cu) on X1 dan X3.

Figure 1c: Countour and surface plot X2 dan X3 in the stationary point. Countour plot and respon surface of peak current (Cu) on X1 dan X4.

Figure 1d: Countour and surface plot X1 dan X4 in the stationary point. Countour plot and respon surface of peak current (Cu) on X2 dan X3.

Figure 1e: Countour and surface plot X1 dan X3 in the stationary point. Countour plot and respon surface of peak current (Cu) on X2 and X4.
Based on Figures 1a-1e, it can be seen the range of values of each pair of variables that allegedly will give the maximum value. As described previously, that at the stationary point obtained an optimum response value. As an alternative to achieving the optimum response value, a combination of other values can be used as shown by the innermost circle of the contour plot. All pairs of points that are in this deepest circle are expected to produce a maximum response value with the following details:
• Each pair of points in the innermost circle of the plot between x3 and x4 will result in a predicted value of >100 response
• Each pair of points in the innermost circle of the plot between x2 and x4 will produce an estimated value of >110 response
• Each pair of points in the innermost circle of the plot between x2 and x3 will produce an estimated value of >110 response
• Each pair of points in the innermost circle of the plot between x1 and x4 will result in a predicted value of >100 response
• Each pair of points in the innermost circle of the plot between x1 and x3 will result in a predicted value of >100 response
• Each pairs of points in the innermost circle of the plot between x1 and x2 will produce an estimated value of >110 response
It can be given the choice of alternatives to generate maximum response values, there is flexibility in determining the level of each factor that is thought to be capable of generating maximum response value.
Application method
To evaluate the validation of the proposed method for the analysis of real samples, the proposed procedure is applied to various samples such as frFuit and vegetable samples (cabbage, broccoli, mustard greens, eggplant, apple, dragon fruit, melon and banana kepok. The Copper concentration in the sample can be seen in Table 6 and determined by the standard addition method using the recommended procedure under optimum conditions in the sample of fruit and vegetable.
The results from Table 5 show that the AdSV method gives satisfactory results when compared to the atomic absorption spectrophotometer (AAS) method. Furthermore, determination of Copper metal in fruit and vegetable samples in AdSV by using calccein can be seen in Table 6.
| Sample | AdSV (mg/L) | AAS (mg/L) |
|---|---|---|
| Broccoli | 3.781 | 1.161 |
| Cauliflower | 2.425 | 1.032 |
| Eggplant | 3.521 | 1.402 |
| Mustard | 5.223 | 1.134 |
| Apples | 3.023 | 1.387 |
| Banana kepok | 3.854 | 1.052 |
| Dragon fruit | 7.231 | 1.171 |
| Melon | 4.872 | 1.397 |
Table 5: Comparison of methods of determination of copper in fruit and vegetable samples.
| Sample | Cu (mg/L) |
|---|---|
| Broccoli | 3.781 |
| Cauliflower | 2.425 |
| Eggplant | 3.521 |
| Mustard | 5.223 |
| Apples | 3.023 |
| Banana kepok | 3.854 |
| Dragon fruit | 7.231 |
| Melon | 4.872 |
Table 6: Determination of copper in fruit and vegetable samples by AdSV using calcein.
Acknowledgement
The authors are grateful to Ministry of Research and Higher Education for supporting this work, April 7, 2017.
References
- Sanusi HS, Syamsu S, Sardjirun S. The content and distribution of heavy metals in various marine fish commodities are transmitted through the TPI Fish Market Jakarta, Thesis, Faculty of Fisheries, Bogor Agricultural Institute. 1985.
- Gholivand MB, Pourhossein A, Shahlaei M. Simultaneous determination of copper and cadmium in environmental water and tea samples by adsorptive stripping voltammetry. Turk J Chem. 2011;35:839-46.
- Edgar N, Arancibia V, Rios R, et al. Simultaneous determination of lead and cadmium in the presence of morin by adsorptive stripping voltammetry with a nafion-ionic liquid-coated mercury film electrode. Int J Electrochem Sci. 2012;7:5521-33.
- Shahryar A, Bahirae A, Abbasai F. A highly sensitive method for simultaneous determination of ultra-trace levels of copper and cadmium in food and water samples with luminal as a chelating agent by adsorptive stripping voltammetry. Food Chem. 2011;129(3):1274-80.
- Deswati C, Suyani H, Loekman U. Simultaneous determination of copper, lead, cadmium and zinc by adsorptive stripping voltammetry in the presence of murexide. Int J Res Chem Environ.2014;4(2):143-52.
- Deswati S, Suyani H, Safni U, et al. Simultaneous determination cadmium, copper and lead in sea water by adsorptive stripping voltammetry in the presence of calcon as complexing agent. Indo J Chem. 2013;13(3):236-41.
- Edgar N, Arancibia V, Rios R, et al. Nafion-mercury coated film electrode for the adsorptive stripping voltammetric of lead and cadmium in the presence of pyrogallol red. Talanta. 2012;99:119-24.
- Danielle SM, Nascimento DS, Insausti M, et al. Simultaneous determination of Cu, Pb, Cd, Ni, Co and Zn in bioethanol fuel by adsorptive stripping voltammetry and multivariate linear regression. Fuel. 2014;137:172-8.
- Herrero E, Arancibia V, Rojas C. Simultaneous determination of Pb(II), Cd(II) and Zn(II) by adsorptive stripping voltammetry using clioquinol as a chelating agent. J Elect Anal Chem. 2014;729:9-14.
- Deswati S, Suyani H, Zein R, et al. Applicability of calcein as a chelating agent for simultaneous determination of Cd (II), Cu (II), Pb (II) and Zn (II) in water samples by adsorptive stripping voltammetry. J Chem Pharm Res. 2015;7(10):833-40.
- Deswati S, Amelia L, Suyani H, et al. Applicability of calcein in the simultaneous dete rmination of trace metals copper, lead and cadmium by cathodic adsorptive stripping voltammetry. Rasayan J Chem. 2015;8(3):362-72.
- Chaiyo S, Chailapakul O, Sakai T, et al. Highly sensitive determination of trace copper in food by adsorptive stripping voltammetry in the presence of 1,10-phenanthroline. Talanta. 2013;108:1-6.
- Deswati S, Suyani H. The Method of the development of analysis Cd, Cu, Pb and Zn in sea water by adsorptive stripping voltammetry (AdSV) in the presence of calcon as complexing agent. Indo J Chem. 2012;12(1):20-7.
- Deswati S, Suyani H. Pengembangan metode analisis logam Cd, Cu, Pb dan Zn dalam air laut secara simultan dengan voltammetri stripping adsorptif. Laporan Akhir Penelitian Hibah Fundamental Tahun Anggaran. 2012.
- Deswati S, Munaf E, Suyani H, et al. The sensitive and simple determination of trace metals Fe, Co, Ni and Cr in water samples by adsorptive stripping voltammetry (AdSV) in the presence of Calcon. Res J Pharm Biol and ChemSci. 2014;5(4):990-9.
- Deswati S, Munaf E, Suyani H, et al. Pengembangan metoda voltammetri stripping adsorptif untuk analisis logam runut, Laporan Penelitian S-3 Program Pasca Sarjana. Jurusan Kimia FMIPA, Universitas Andalas. 2014.
- Deswati S, Munaf E, Suyani H, et al. Simultaneous determination of trace amounts of iron, cobalt, nickel and chromium in water samples with calcon as a complexing agent by adsorptive stripping voltammetry. Asian J Chem.2015;27(11):3978-82.
- Deswati S, Suyani H, Zein R, et al. Adsorptive stripping voltammetric method for the individual determination of Cd (II), Cu (II) Pb (II) and Zn (II) in vegetable sample using calcein. Rasayan J Chem. 2017;pp:549-57.
- Ensafi AA, Abbasi S, Mansour HR. Differential pulse adsorptive stripping voltammetric determination of copper (II) with 2-mercaptobenzimidazol at Hanging Mercury-Drop Electrode. Anal Sci. 2001;17:609-12.
- Zang S, Huang W. Simultaneous determination of Cd (II) and Pb (II) using a chemically modified electrode. Anal Sci. 2001;17:983-5.
- Jugade RM, Joshi AP. Highly sensitive adsorptive stripping Voltammetric method for the ultra-trace determination of chromium(VI). Anal Sci. 2006;22:571-4.
- El-Shahawi MS, Bashammakh AS, Al-Shibaai AA, et al. Chemical speciation of Antimony (III and V) in water by adsorptive cathodic stripping voltammetry using the 4-(2-thiazolylazo)-resorcinol.Electroanal. 2011;23(3):747-54.
- Bezerra MA, Santelli RE, Oliveira EP, et al. Respon surface methology (RSM) as a tool for optimization in analytical chemistry. Talanta. 2008;76;965-77.
- Marcin G, Golimowski J. Sensitive and very selective determination of titanium by adsorptive-catalytic stripping voltammetry with methylthymol blue, xylenol orange and calcein. Anal Chem Acta. 2001;427:55-61.
- Paolicchi I, Renedo OD, Lomillo MAL, et al. Application of an a optimazation procedure in adsorptive stripping voltammetry for the determination of trace contaminant metals in aqueos medium. Anal Chem Acta. 2004;511:223-9.
- Yilmaz S, Ozturk B, Ozdemir D, et al. Application of experimental design on determination of aluminum content in saline samples by adsorptive cathodic stripping Voltammetry. Turk J Chem. 2013;37:316-24.
- Espada-Bellido E, Galindo-Riano MD, Garcia-Vargas M. Sensitive adsorptive stripping voltammetric method for determination of lead in water using multivariate analysis for optimization. J Hazard Mat. 2009;166:1326-31.
- Deswati S, Suyani H, Zein R, et al. Application of respon surface methodology for the determination of cadmium in sea water by adsorptive stripping voltammetry in the presence of calcon. J Chem Pharm Res. 2015;7(8):750-7.
- Deswati S, Izzati Rahmi HG, Suyani H, et al. Application of central composite design for optimization the determination of lead adsorptive cathodic stripping voltammetry. Rasayan J Chem. 2016;9(1):8-17.
- Dewi AK, Sumarjaya IW, Srinadi IGAM. Penerapan metode permukaan respons dalam masalah optimasi. E-Journal Matematika. 2013;2(2):32-6.
- Deswati S, Izzati Rahmi HG, Suyani H, et al. Respon surface methodology optimization for the determination of zinc in water samples by adsorptive stripping voltammetry.J Chem Pharm Res. 2015;7(10):862-70.
- Deswati S, Izzati Rahmi HG, Suyani H. Optimization central composite design for the simultaneous determination of Cd(II) ion in fruit and vegetable samples by adsorptive stripping voltammetry. Oriental J Chem. 2016;32(3):1493-1502.
