Original Article
, Volume: 13( 2)Influence of UVC on Growth Behavior, Internal Structure, Enzymes and Free Radical of Nigella Sativa Plant
- *Correspondence:
- Abu Bakr El-Bediwi , Physics Department, Faculty of Science, Mansoura University, Egypt, Tel: 20 50 2383781, E-mail: baker_elbediwi@yahoo.com
Received: August 07, 2018; Accepted: August 10, 2018; Published: August 20, 2018
Citation: El-Bediwi AB, Hasanin S, Abdelrazek A, et al. Influence of UVC on Growth Behavior, Internal Structure, Enzymes and Free Radical of Nigella sativa Plant. 2018;13(2):142.
Abstract
The aim of this research is to study the effect of ultraviolet- C from UV lamp on growth stages, color, structure and absorption of Nigella sativa plant. The results show that structure (internal and molecular) which leaf growth of Nigella sativa plant changed and may be die after exposure to UVC for different times and dissimilar distances. Also activities of super oxide dismutase (SOD) and glutathione reductase (GR), phenol, flavonoid, Proline and GSH contents and phenyl alanine amonia lyase (PAL) in Nigella sativa increased but activity of ascorbic peroxidase (APX) decreased after exposure to UVC from different distances and different time intervals. DPPH free radicals and ABTS radical scavenging activities increased continuously with increasing exposure time.
Keywords
Nigella sativa; UVC, Internal structure; SOD; GR; APX; Free radicals; IR; X-ray
Introduction
The sun emits energy over a broad spectrum of wavelengths such as visible light, infrared radiation and ultraviolet (UV) radiation. UV radiation has a shorter wavelength and higher energy than visible light. Our atmosphere’s stratospheric ozone layer shields us from most UV radiation. The penetrated of UV through leaf tissues increased as wavelength increases, UVA can reach much deeper target sites in the leaves than UVB [1]. Although UVA is less efficient than UVB in mediating some biological responses such as DNA damage, the high UVA levels reaching the deeper tissues can compensate for the lower reactivity [2]. When the germinating green bean seeds were exposed to UVC (254 nm) for different time intervals ranging from 15-60 minutes and then subjected to salinity stress, the seedlings was less affected by salinity stress as compared to non-treated ones [3]. When the ground nut seeds exposed to UVC for period varying from 5-60 minutes, the seedling vigour and flower production increased as compared to controls. Similarly, the pod biomass also increased in all UVC treatments [4]. Though changes in the UVA: photosynthetically active radiation (PAR; 400-700 nm) ratios are less marked than those in the UVB: PAR ratio, they are an important consideration in experimental design [5-9]. The effect of UVC on morphological, internal structure, vitamins and free radical of garden cress plant has been studied and analyzed [10]. The aim of this research is to study the effect of UVC on morphological, internal structure, enzymes and antioxidant activity for Nigella sativa plant that effected on their medical applications.
Materials and experimental methods
The pure seeds of Nigella sativa were received from Egyptian Ministry of Agriculture. The ultra-violet system consists of one fluorescent lamp (Type-C ranged from 2000-2800 Å). The power of the lamp equal to 15 watt and the system covered totally with reflected surfaces (Aluminum foil) to illuminate the sample from all sides. Structure of Nigella sativa is studied by Shimadzu X-ray diffractometer, (Dx-30, Japan) Cu-Ka radiation with l=1.54056 Å at 45 kV and 35 mA and Ni-filter, in the angular range 2q ranging from 0 to 100° in continuous mode with a scan speed 5 deg/min. Molecular structure of Nigella sativa is studied by Nicolet™ iS™ 10 FT-IR Spectrometer from USA. Absorption of extracted Nigella sativa plant is measured by UV-2100 Spectrophotometer.
Results
Growth behavior
FIG. 1 shows the growth (root and leaf growth) of Nigella sativa before and after exposure to UVC for 1, 2, 3 and 4 hours. It is clear that, the color and shape of Nigella sativa plant changed and may die due to their internal structure damage after exposure to UVC at different times.

FIG. 1. Growth behavior of normal Nigella sativa and after exposure to UVC.
X- ray diffraction analysis
FIG. 2 shows x- ray diffraction patterns of normal Nigella sativa and after exposure to UVC for 4 hours and dissimilar distance which have broad beak with different intensity, area and position. TABLE 1 presented the details of x-ray analysis for Nigella sativa comes from dives as Peak position (2?) is shifted, inter-planer spacing or distance between two planes and full width half maximum (FWHM) decreased but peak intensity and area under the peak increased. That is meant, internal structure such as chain cluster, chain bonded, chain size and chain position changed after exposure to UVC.

FIG. 2. X- ray diffraction patterns for normal Nigella sativa and after exposure to UVC.
| Normal sample | ||||
|---|---|---|---|---|
| 2q | d Å | Int. Count | Area | FWHM |
| 20.07 | 4.42075 | 83.6 | 649.825 | 8.488 |
| Distance = 5 cm | ||||
| 2q | d Å | Int. Count | Area | FWHM |
| 20.303 | 4.3705 | 112 | 1106.8 | 8.234 |
| Distance = 10 cm | ||||
| 2q | d Å | Int. Count | Area | FWHM |
| 20.146 | 4.4042 | 102 | 985.74 | 7.628 |
| Distance = 15 cm | ||||
| 2q | d Å | Int. Count | Area | FWHM |
| 20.535 | 4.3217 | 89.3 | 1006.62 | 7.969 |
| Distance = 20 cm | ||||
| 2q | d Å | Int. Count | Area | FWHM |
| 20.6109 | 4.38748 | 88.6 | 960.502 | 7.645 |
| Distance = 25 cm | ||||
| 2q | d Å | Int. Count | Area | FWHM |
| 20.385 | 4.36641 | 112 | 1253.64 | 7.335 |
TABLE 1. X- ray diffraction analysis for normal Nigella and after exposure to UVC.
IR analysis
A plot of wave number (X- axis) vs. present transmittance (Y-axis) {IR spectrum} for normal Nigella sativa plant and after exposure to UVC for one and four hours at dissimilar distance is shown in FIG. 3. The analysis of IR spectrum listed in TABLE 2 shows that, transmittance Int. % at position ? 1745, ?2926 and ? 3446 cm-1 varied (decreased) after exposure to UVC for one, two, three and four hours at distance 5, 10 and 25 cm from UV source. From IR (graphs and analysis), molecular structure {C- O (1745 cm-1), C-H (2926 cm-1) and O- H (?3422 cm-1) bonded usually broad and strong} changed after exposure to UVC for different exposure times and dissimilar distances from the source. That is because each interatomic bond may vibrate in several different motions (stretching or bending) and individual bonds may absorbed at more than one IR frequency. Stretching absorptions usually produce stronger peaks than bending.

FIG. 3. IR spectrum of normal Nigella and after exposure to UVC.
| Exposure Time = 0 | |
|---|---|
| Position cm-1 | Transmittance Int. % |
| 1743 | 90.27 |
| 2925 | 91.19 |
| 3442 | 92.4 |
| Exposure Time = 1 Distance = 5 cm | |
| Position cm-1 | Transmittance Int. % |
| 1745 | 23.84 |
| 2926 | 8.79 |
| 3446 | 47.02 |
| Exposure Time = 1 Distance = 10 cm | |
| Position cm-1 | Transmittance Int. % |
| 1745 | 50.25 |
| 2925 | 34.81 |
| 3447 | 78.76 |
| Exposure Time = 1 Distance = 15 cm | |
| Position cm-1 | Transmittance Int. % |
| 1745 | 27.28 |
| 2926 | 7.92 |
| 3446 | 47.14 |
| Exposure Time = 1 Distance = 20 cm | |
| Position cm-1 | Transmittance Int. % |
| 1744 | 63.36 |
| 2925 | 39.36 |
| 3447 | 68.74 |
| Exposure Time = 1 Distance = 25 cm | |
| Position cm-1 | Transmittance Int. % |
| 1744 | 78.01 |
| 2925 | 69.34 |
| 3447 | 88.52 |
| Exposure Time = 4 Distance = 5 cm | |
| Position cm-1 | Transmittance Int. % |
| 1745 | 24.97 |
| 2925 | 7.83 |
| 3421 | 42.08 |
| Exposure Time = 4 Distance = 10 cm | |
| Position cm-1 | Transmittance Int. % |
| 1744 | 66.84 |
| 2925 | 45.06 |
| 3447 | 81.41 |
| Exposure Time = 4 Distance = 15 cm | |
| Position cm-1 | Transmittance Int. % |
| 1745 | 65.13 |
| 2925 | 49.31 |
| 3446 | 78.4 |
| Exposure Time = 4 Distance = 20 cm | |
| Position cm-1 | Transmittance Int. % |
| 1745 | 63.27 |
| 2925 | 48.12 |
| 3446 | 82.19 |
| Exposure Time = 4 Distance = 25 cm | |
| Position cm-1 | Transmittance Int. % |
| 1745 | 50.75 |
| 2925 | 32.72 |
| 3447 | 74.14 |
TABLE 2. IR analysis of normal Nigella and after exposure to UVC.
Effect of UV on enzyme activity of Nigella sativa extract
The activities of super oxide dismutase (SOD), glutathione reductase (GR) and phenyl alanine amonia lyase (PAL) in the nigella are enhanced (increase) as listed in TABLE 3-5 after exposure to UVC at dissimilar distance for different time but the activities of ascorbic peroxidase (APX) is decreased as listed in TABLE 6.
| Time (h) | Enzyme activity (Umg1 protein) | ||||
|---|---|---|---|---|---|
| 5 cm | 10 cm | 15 cm | 20 cm | 25 cm | |
| 0 | 22.4 ± 0.4 | 22.4 ± 0.4 | 22.4 ± 0.4 | 22.4 ± 0.4 | 22.4 ± 0.4 |
| 1 | 29.4 ± 0.6 | 28.0 ± 0.8 | 26.0 ± 0.4 | 25.4 ± 0.4 | 24.6 ± 0.4 |
| 2 | 36.3 ± 0.4 | 34.3 ± 0.7 | 30.0 ± 0.6 | 27.0 ± 0.6 | 23.7 ± 0.6 |
| 3 | 44.0 ± 0.5 | 41.0 ± 0.6 | 33.2 ± 0.5 | 30.4 ± 0.6 | 25.4 ± 0.5 |
| 4 | 52.5 ± 0.6 | 45.0 ± 0.5 | 40.0 ± 0.7 | 35.0 ± 0.5 | 28.0 ± 0.4 |
TABLE 3. SOD enzyme activity in Nigella before and after exposure to UVC.
| Time (h) | Enzyme activity (Umg1 protein) | ||||
|---|---|---|---|---|---|
| 5 cm | 10 cm | 15 cm | 20 cm | 25 cm | |
| 0 | 31.0 ± 0.3 | 31.0 ± 0.3 | 31.0 ± 0.3 | 31.0 ± 0.3 | 31.0 ± 0.3 |
| 1 | 36.4 ± 0.5 | 35.6 ± 0.7 | 33.6 ± 0.4 | 32.0 ± 0.6 | 31.6 ± 0.4 |
| 2 | 44.2 ± 0.6 | 39.4 ± 0.6 | 36.0 ± 0.7 | 34.0 ± 0.5 | 32.0 ± 0.5 |
| 3 | 59.0 ± 0.4 | 44.3 ± 0.4 | 39.7 ± 0.3 | 36.2 ± 0.6 | 34.0 ± 0.6 |
| 4 | 67.3 ± 0.7 | 56.6 ± 0.5 | 50.2 ± 0.6 | 40.2 ± 0.4 | 38.3 ± 0.6 |
TABLE 4. GR enzyme activity in Nigella before and after exposure to UVC.
| Time (h) | Enzyme activity (Umg1 protein) | ||||
|---|---|---|---|---|---|
| 5 cm | 10 cm | 15 cm | 20 cm | 25 cm | |
| 0 | 18.4 ± 0.4 | 18.4 ± 0.4 | 18.4 ± 0.4 | 18.4 ± 0.4 | 18.4 ± 0.4 |
| 1 | 21.3 ± 0.3 | 20.0 ± 0.4 | 19.3 ± 0.6 | 18.6 ± 0.4 | 18.5 ± 0.6 |
| 2 | 24.0 ± 0.5 | 22.3 ± 0.5 | 21.0 ± 0.5 | 19.0 ± 0.6 | 18.7 ± 0.8 |
| 3 | 29.3 ± 0.6 | 25.4 ± 0.6 | 22.3 ± 0.4 | 20.3 ± 0.7 | 19.4 ± 0.7 |
| 4 | 36.4 ± 0.7 | 29.4 ± 0.6 | 25.0 ± 0.7 | 21.0 ± 0.7 | 20.2 ± 0.4 |
TABLE 5. PAL enzyme activity in Nigella before and after exposure to UVC.
| Time (h) | Enzyme activity (Umg1 protein) | ||||
|---|---|---|---|---|---|
| 5 cm | 10 cm | 15 cm | 20 cm | 25 cm | |
| 0 | 22.8 ± 0.7 | 22.8 ± 0.7 | 22.8 ± 0.7 | 22.8 ± 0.7 | 22.8 ± 0.7 |
| 1 | 21.0 ± 0.6 | 18.3 ± 0.6 | 16.2 ± 0.4 | 13.2 ± 0.4 | 11.4 ± 0.3 |
| 2 | 18.3 ± 0.4 | 15.2 ± 0.5 | 13.0 ± 0.6 | 10.2 ± 0.5 | 7.3 ± 0.2 |
| 3 | 15.5 ± 0.3 | 11.0 ± 0.5 | 9.1 ± 0.3 | 7.0 ± 0.2 | 4.3 ± 0.2 |
| 4 | 12.0 ± 0.4 | 8.4 ± 0.4 | 5.0 ± 0.2 | 3.0 ± 0.2 | 2.0 ± 0.1 |
TABLE 6. APX enzyme activity in Nigella before and after exposure to UVC.
Effect of UVC on secondary metabolites content in Nigella extract
The result in TABLES 7-10 for phenol, flavonoid, proline and GSH of Nigella are obtained after exposure to UVC from different distances and different time intervals. In response to UVC the higher content of phenol, flavonoid, proline and GSH of Nigella increased gradually by exposure to UVC which dependent on the exposure time.
| Time (h) | Total phenol | ||||
|---|---|---|---|---|---|
| 5 cm | 10 cm | 15 cm | 20 cm | 25 cm | |
| 0 | 11.0 ± 0.6 | 11.0 ± 0.6 | 11.0 ± 0.6 | 11.0 ± 0.6 | 11.0 ± 0.6 |
| 1 | 22.3 ± 0.6 | 20.3 ± 0.5 | 18.0 ± 0.5 | 13.2 ± 0.4 | 12.0 ± 0.5 |
| 2 | 25.4 ± 0.7 | 22.1 ± 0.6 | 20.3 ± 0.4 | 15.2 ± 0.5 | 13.2 ± 0.6 |
| 3 | 27.0 ± 0.5 | 24.2 ± 0.5 | 22.3 ± 0.4 | 18.0 ± 0.6 | 15.6 ± 0.5 |
| 4 | 28.4 ± 0.7 | 26.3 ± 0.7 | 24.4 ± 0.7 | 20.4 ± 0.7 | 17.2 ± 0.7 |
TABLE 7. Total phenol content in Nigella sativa before and after exposure to UVC.
| Time (h) | Flavonoid content | ||||
|---|---|---|---|---|---|
| 5 cm | 10 cm | 15 cm | 20 cm | 25 cm | |
| 0 | 6.4 ± 0.4 | 6.4 ± 0.4 | 6.4 ± 0.4 | 6.4 ± 0.4 | 6.4 ± 0.4 |
| 1 | 15.0 ± 0.5 | 12.3 ± 0.5 | 11.4 ± 0.4 | 10.2 ± 0.4 | 9.8 ± 0.6 |
| 2 | 17.5 ± 0.6 | 15.6 ± 0.6 | 13.2 ± 0.7 | 12.0 ± 0.7 | 11.5 ± 0.4 |
| 3 | 25.3 ± 0.7 | 18.8 ± 0.5 | 15.0 ± 0.7 | 14.3 ± 0.5 | 13.0 ± 0.3 |
| 4 | 38.0 ± 0.6 | 26.4 ± 0.6 | 22.4 ± 0.6 | 18.4 ± 0.6 | 15.0 ± 0.5 |
TABLE 8. Total flavonoid content in Nigella sativa before and after exposure to UVC.
| Time (h) | Proline content | ||||
|---|---|---|---|---|---|
| 5 cm | 10 cm | 15 cm | 20 cm | 25 cm | |
| 0 | 32.4 ± 0.6 | 32.4 ± 0.6 | 32.4 ± 0.6 | 32.4 ± 0.6 | 32.4 ± 0.6 |
| 1 | 39.4 ± 0.5 | 37.0 ± 0.6 | 35.0 ± 0.4 | 33.9 ± 0.5 | 33.0 ± 0.7 |
| 2 | 46.0 ± 0.6 | 42.3 ± 0.7 | 39.2 ± 0.6 | 36.4 ± 0.5 | 34.0 ± 0.6 |
| 3 | 55.3 ± 0.6 | 49.0 ± 0.5 | 43.3 ± 0.7 | 40.4 ± 0.6 | 38.4 ± 0.7 |
| 4 | 68.8 ± 0.8 | 55.0 ± 0.5 | 47.0 ± 0.6 | 43.0 ± 0.7 | 40.0 ± 0.7 |
TABLE 9. Proline content in nigella before and after exposure to UVC.
| Time (h) | GSH content | ||||
|---|---|---|---|---|---|
| 5 cm | 10 cm | 15 cm | 20 cm | 25 cm | |
| 0 | 52.0 ± 0.9 | 52.0 ± 0.9 | 52.0 ± 0.9 | 52.0 ± 0.9 | 52.0 ± 0.9 |
| 1 | 86.3 ± 0.6 | 64.3 ± 0.8 | 60.0 ± 0.7 | 56.0 ± 0.5 | 54.0 ± 0.3 |
| 2 | 79.4 ± 1.0 | 70.3 ± 0.8 | 64.0 ± 0.7 | 59.3 ± 0.7 | 56.3 ± 0.7 |
| 3 | 86.0 ± 1.0 | 80.2 ± 0.7 | 70.2 ± 0.6 | 64.2 ± 0.6 | 60.0 ± 0.8 |
| 4 | 96.2 ± 0.9 | 84.0 ± 0.5 | 75.3 ± 0.8 | 70.0 ± 0.6 | 63.0 ± 0.5 |
TABLE 10. GSH content in Nigella before and after exposure to UVC.
Effect of UVC on free radicals scavenging activity of Nigella sativa extract
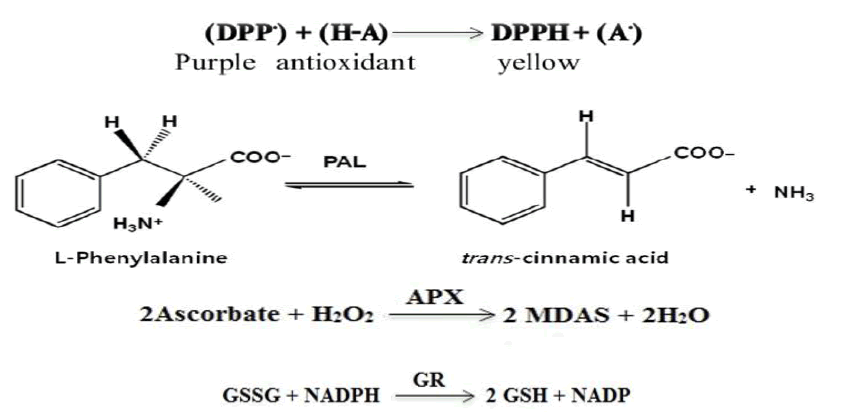
The methanolic extract of Nigella seeds expressed a potent DPPH radical scavenging potential as shown in TABLE 11. Adding the plant extract to DPPH solution resulted in increasing the scavenging activity by increasing the time of exposure and those which exposed to UVC from 25 cm showed the higher scavenging activity. The antioxidant compounds in methanolic extract of Nigella neutralized the free radical character of DPPH. This occurs through transferring hydrogen atoms or electrons to the free radical DPPH leading to changing the purple color to yellow color. The extent of color change of DPPH is dependent on the structure of bioactive compounds in the plant extract. It was reported that the hydroxyl groups of flavonoids are favorable for this reactions. The degree of color change is an indicator for the scavenging potential of Nigella extract in term of donating ability of hydrogen atoms. The inhibition of ABTS radical caution by methanol extract of Nigella expressed comparable scavenging activity with L-ascorbic acid as shown in TABLE 12. This indicates that the extract seems to have antioxidant capability due to the presence of polyphenols which may act on a similar fraction reduction by donating electrons. This indicates that some extract components are electron donors which react with free radicals. In this experiment the ABTS radical scavenging activity increased continuously with increasing the time of exposure. However, the exposure to UVC from 25 cm was the most effective distance.
| Time (h) | Scavenging activity % | ||||
|---|---|---|---|---|---|
| 5 cm | 10 cm | 15 cm | 20 cm | 25 cm | |
| 0 | 13.7 ± 0.4 | 13.7 ± 0.4 | 13.7 ± 0.4 | 13.7 ± 0.4 | 13.7 ± 0.4 |
| 1 | 16.3 ± 0.9 | 21.5 ± 0.7 | 23.9 ± 0.5 | 27.3 ± 0.8 | 30.0 ± 0.4 |
| 2 | 22.0 ± 0.8 | 25.0 ± 0.6 | 25.7 ± 0.4 | 30.0 ± 0.5 | 45.4 ± 0.3 |
| 3 | 25.6 ± 0.7 | 26.4 ± 0.5 | 28.4 ± 0.5 | 35.0 ± 0.5 | 55.0 ± 0.5 |
| 4 | 48.3 ± 0.6 | 52.4 ± 0.6 | 66.6 ± 0.6 | 70.0 ± 0.6 | 78.4 ± 0.6 |
TABLE 11. DPPH free radicals scavenging activity of Nigella extract before and after exposure to UVC.
| Time (h) | Scavenging activity % | ||||
|---|---|---|---|---|---|
| 5 cm | 10 cm | 15 cm | 20 cm | 25 cm | |
| 0 | 19.4 ± 0.4 | 19.4 ± 0.4 | 19.4 ± 0.4 | 19.4 ± 0.4 | 19.4 ± 0.4 |
| 1 | 25.3 ± 0.4 | 31.4 ± 0.7 | 33.4 ± 0.6 | 49.0 ± 0.8 | 65.0 ± 0.6 |
| 2 | 33.3 ± 0.6 | 36.3 ± 0.7 | 40.2 ± 0.8 | 54.2 ± 0.9 | 75.0 ± 0.7 |
| 3 | 35.0 ± 0.7 | 41.0 ± 0.8 | 45.3 ± 0.5 | 56.0 ± 0.6 | 84.0 ± 0.5 |
| 4 | 49.4 ± 0.7 | 59.4 ± 0.7 | 64.3 ± 0.7 | 74.0 ± 0.7 | 94.0 ± 0.7 |
TABLE 12. ABTS radical scavenging activity in Nigella before and after exposure to UVC.
Discussions
The growth behavior and internal structure (molecular and internal structure) of Nigella changed after exposure to UVC at dissimilar distance for different time due to loss of water molecules or beak interatomic bonds.
From our results, (enzyme activity, secondary metabolites and free radicals scavenging activity), increase in phenol and flavonoid content in Nigella is due to increase of PAL enzyme. This enzyme is responsible for increasing of phenol and flavonoid content. Increase in vitamin E and vitamin C content in Nigella this is due to decrease of enzyme APX. This enzyme is responsible for increasing of vitamin E and vitamin C content. Increase in proline and GSH content in Nigella this is due to increase of enzyme GR. This enzyme is responsible for increasing proline and GSH content. Increasing in DPPH and ABTS radical scavenging due to increase in free radical.
All these changes followed up the chemical equations below:
Conclusion
1. The growth behavior and internal structure (molecular and internal structure) of Nigella changed after exposure to UVC at dissimilar distance for different time.
2. The activities of super oxide dismutase (SOD), glutathione reductase (GR) and phenyl alanine amonia lyase (PAL) in the nigella are increased after exposure to UVC at dissimilar distance for different time but the activities of ascorbic peroxidase (APX) is decreased.
3. The content of phenol, flavonoid, proline and GSH in Nigella increased gradually after exposure to UVC which dependent on the exposure time.
References
- Bornman JF, Vogelmann TC. Penetration of blue nad UV radiation measured by fiber optics in spruce and fir needles. Physiol Plant. 1988;72:699-705.
- McKenzie R, Smale D, Kotkamp M. Relationship between UVB and erythemally weighted radiation. Photochem Photobiol Sci. 2004;3:252-6.
- Aboul Fotouh MM, Moawad FG, El-Naggar HA, El-Din MT, Eldeen HS. Influence of seed treatment with uv-c on saline stress tolerance in green beans (Phaseolus vulgaris L.). Environ Sci. 2014;9:391-414.
- Neelamegam R, Sutha T. UV-C irradiation effect on seed germination, seedling growth and productivity of groundnut (Arachis hypogaea L.). Int J Curr Microbiol App Sci. 2015;4:430-43.
- Krizek DT. Influence of PAR and UV?A in Determining Plant Sensitivity and Photomorphogenic Responses to UV?B Radiation. Photochem Photobiol. 2004;79:307-15.
- Götz M, Albert A, Stich S, et al. PAR modulation of the UV-dependent levels of flavonoid metabolites in Arabidopsis thaliana (L.) Heynh. leaf rosettes: cumulative effects after a whole vegetative growth period. Protoplasma. 2010;243:95-103.
- Morales LO, Tegelberg R, Brosché M, et al. Effects of solar UV-A and UV-B radiation on gene expression and phenolic accumulation in Betula pendula leaves. Tree Physiol. 2010;30:923-34.
- Morales LO, Tegelberg R, Brosché M, et al. Temporal variation in epidermal flavonoids due to altered solar UV radiation is moderated by the leaf position in Betula pendula. Physiol plant. 2011;143:261-70.
- Barnes PW, Kersting AR, Flint SD, et al. Adjustments in epidermal UV?transmittance of leaves in sun?shade transitions. Physiol Plant. 2013;149:200-13.
- El-Bediwi AB, Hasanin S, Abdelrazek A, El-Shora HM. Effect of Ultraviolet on Morphological and Secondary Metabolites Content of Garden Cress.2018;1874:1.