Original Article
, Volume: 15( 1)Design of PID and Model Predictive Controller for Three Phase Flow (Crude Oil+Water+Air) through Helical Coil and Control Valve in Series
- *Correspondence:
- Krishnamoorthy EEE Department Government college of Engineering Sengipatti, Thanjvur, Tamil Nadu, India, Tel: +919842285751; E-mail: krishandkrish@yahoo.com
Received: February 03, 2017 Accepted: March 06, 2017 Published: March 13, 2017
Citation: Krishnamoorthy P, Bharanikumar R. Design of PID and Model Predictive Controller for Three Phase Flow (Crude Oil+Water+Air) through Helical Coil and Control Valve in Series. Int J Chem Sci. 2017;15(1):114.
Abstract
Experimental model has been constructed in the laboratory to study the pressure drop characteristics for crude oil+water+gas flow through helical coils and control valve in series. This kind of three phase flow occurs in petroleum industries especially in oil rigs. When pumping crude oil from the oil well, it is coming out as a mixture of water and natural gas So the well pump has to pump out this three-phase mixture together. This crude oil+water+gas mixture creates three phase flow. This kind of three phase mixture is pumped by oil well pump and transported by pipes to the oil refinery for the further process. Often these pumps are repairing because of air-lock, holdup, and oil leakage in oil seal. So, transportation stops, this leads to heavy loss to the oil company. So, the pumping system has to be designed carefully with proper controller in the present work an experimental set up has been constructed to test the above three phase flow. Crude oil and water is mixed in a tank by an electric stirrer in a tank and air is injected by compressor, so these three-component flow via helical coil and control valve in series, pressure drop is measured across helical coil and control valve for different air flow rate and mixture flow rate. The pressure drop versus flow rate graph has been drawn by using the experimental data. Linearization method is used to obtain the second order equation for the above graph, using these equation proper MPC and PID controller is designed This controller will control the opening percentage of control valve, The MPC controller will control the three phases flow rate in the pipes by adjusting the valve and increase the crude oil flow rate. So, we can improve the extraction of crude oil rate from the oil rig and improve the efficiency rate of the oil rig system.
Keywords
Three phase flow; Pressure drop characteristics; Multi-phase flow; PID controller; MPC controller; Pneumatic control valve
Introduction
Crude oil+water+air three phase flow mostly occurs in the oil rig and Petroleum exploration industries; these three components are immiscible and it occurs in transporting the crude oil+water+natural gas mixtures from Off-shore production. When we drill inside the earth for crude oil, Water and natural gas are frequently coming out from the oil well with crude oil; naturally coming water in the oil well is called connate water. Injected water into the oil well at later stage in the production is known as injected water. So, we require knowledge on the flow characteristics of the three-phase flow, like pressure drop characteristic, holdup problem and different flow patterns in multi-phase flow to design and operating of oil pumps and control valves used in the pipelines of oilrig. Another issue we have to addressed is sand which is also coming out of the rig in many cases, so the pumping system has to be designed to withstand with four phase. so, design of the pipe lines system, pumping system and controllers used to control of such a complex three phase flow is very difficult. Here we have to understand that three immiscible fluids are involving in the system.
From 1960 to 2005 many research papers were presented for two phase flow, Small amount of research papers were published about three-phase flow [1] conduct a test in oil water gas study in pipes. Their experimental study was not related to three phase flow system.
Wegmann et al. [2] did experiments in three phase liquid-liquid-gas flows in 5.6 mm and 7 mm inner diameter alone Spedding et al. [3] and Chen et al. [4] has studied horizontal concurrent flow and pressure drop. They have identified many flow patterns.
Zhang et al. [5] constructed a unified model for gas-liquid pipe flow and they have studied the dynamics of two phase flow they did not study the three phase flow dynamics Tran et al. [6] have studied transient simulation of two phase flow pipes alone not using three phase system, Desalis et al. [7] have studied dynamic simulation of multiphase pumps and the have studied the complication of pumping gas-oil-water together in a pumb. In this work, also such complication is reduced by proper MPC controller. Petersen et al. [8] developed a general model for multiphase flow. By using this model operation during drilling, well-control, and intervention were studied about the three-phase flow. But here in this work such kind of model is constructed in the laboratory and the proper MPC and PID control of three phase flow through pipes and control valve were not designed. Mann et al. [9] did Time domain based design and analysis of new PID tuning rules. And Zhuang et al. [10] did automatic tuning of optimum PID controllers, which is slightly modified and used here for three phase flow controllers. Nikolaoo et al. [11] studied about model predictive controllers for critical industrial application, he did not design it for three phase flow system. Garcia et al. [12] have studied robust multi model predictive controller for distributed parameter system, they did not design a controller for three phase oil-water-air system Acikgoz et al. [13] found some flow regimes for multi-phase flow in they were not study about the MPC and PID controllers for the multi-phase flow. All mentioned works were about multi-phase flow through pipes only. Small amount of research work was conducted on three phase flow especially on crude oil-water-air system. In modern industrial reactor and nuclear boiler, the helical coils are used. So, in this work we include coil for the purpose of study MPC and PID controllers design for multi-phase flow research work was not conducted so far. So, in this work we make an attempt to design such kind of controller for crude oil-water-air system.
The aim of the present work is to design a MPC and PID controller which is controlling the multi-phase system in an efficient manner. The pressure drop characteristics and flow pattern characteristic of crude oil-water-air three phase mixtures at different airflow rate and mixture flow rate and different valve opening level (25% open, 50% open, 75% open, 100% open) were collected using the experimental setup which is shown in the Figure. 1. The combined density of crude oil+water is varied by mixing them in various ratios. An electric stirrer is designed to mix these two in the tank the combined density of crude oil+water is varied from 0.81 kg/liter to 0.97 kg/liter. During the experiment the pressure drop across the helical coil and control valve are measured by digital pressure gauge and manometers.

Figure 1: Experimental setup for crudeoil+water+air (Three Phase Flow) through helical coil and control valve in series.
In this experimental study, digital pressure transducer measures the pressure drop across the helical coil and control valve. Large amount of data was collected by varying the air flow rate. Charts are drawn between flow and pressure drop. It is seen that the curves are nonlinear in nature. Proper linearization technique is used to obtain corresponding equation. From the linear equation MPC and PID controller parameter such as Kp, Kd, Ki were obtained. By using the above parameter, a proper controller is designed. By operating the above controller, we can increase the crude oil extracting rate from the oil rig and thus we can increase the overall efficiency of the system (Figure. 1).
Experimental setup
An experimental model has been constructed in the laboratory to obtain crude oil-water-air three phase flow by using this model. The pressure drop measurement across the helical coil and control valve is collected by using this experimental setup. The Tube used in this experiment has 3.3 m length, 15 cm coil diameter and 22.6 mm internal diameter, the experimental model shown in Figure. 1.
It has the following accessories:
• Compressor pump (for air)
• Storage tank (for mixing water and crude oil)
• Helical coil tube
• Centrifugal pump (for pumping water and crude oil mixture)
• Pneumatic control valve
• Digital pressure transducer (across valve and helical coil)
• Motorized stirrer
A brief description of the above accessories is given below
Air compressor: A 3 HP 650 RPM two stage reciprocating type air compressors is used in this experimental setup for compressing air. A long tube carrying pressurized air from the compressor is used for injecting air into the system. A Rota meter is used to measure the air flow rate and a control valve is used to adjust the air flow rate.
Centrifugal pump: A quarter HP 2800 RPM and 18-meter head operated at single phase 230V, 50 Hz A.C supply centrifugal pump is used in this experimental setup to pump the crude oil and water mixture from the tank through the pipeline, helical coiled tube and control valve.
Magnetic flow meter: this type of flow meter is working according to faraday’s law of electro magnetism. It is used in this experimental setup to measure the crude oil plus water mixture flow rate in an easier way.
Rota meter: Two Rota meters are used in this experimental setup one is for measuring air flow rate and another one is for crude oil plus water mixture flow rate. Both are coming under area flow meter type.
Control value (Pneumatic): The control Value used in this experimental setup is pneumatic type. This will actuate by compressed air from the compressor. We can adjust the valve opening from zero percent to 100% by adjusting the valve in proper way. The pneumatic control valve shown in Figure. 2.

Figure 2: Parts of pneumatic control valve.
The following equation is used for calculating discharge across the valve in liter per minute
Q=CV ΔPv/G
Q=Discharge rate in liters per minute,
ΔP=Pressure drop between valve (Pounds per square inch)
G=Specific gravity (assumed one for water)
Cv=Valve capacity factor
Digital pressure transducer: Two digital pressure transducer are used across the helical coiled tube and control valve to measure the pressure drop across helical coil and control valve. These pressure signals are also send to the MPC controller for controlling the flow rate.
Stirrer: A Stirrer is used in the storage tank to stir up the crude oil and water. The stirrer is made up of metal having length of 0.5 meter. It is operated by a motor. By varying the motor speed, we can adjust the stirrer speed. In this experimental model, the stirrer speed is constant at 1250 revolutions per minute.
Experimental Procedure
Connections are given as per the Figure. 1. Crude oil and water is taken in the storage tank and these two are mixed by using the motorized stirrer. This mixture is transported to the test section by centrifugal pump connected in model; Rota meter connected in this mixture carrying pipe measures the flow rate. Air from the compressor is supplied to the test section and air Rota meter is attached in the air line is used to measure the flow rate of air. Two digital pressure transducers were used to measure the pressure drop across control valve and helical coil section. The air lock mixture line and airline was removed. The air flow rate is kept constant at 30 LPH by adjusting the valve in the air line (Figure. 3). The mixture flow rate is varied to 30 LPH, 60 LPH, 90 LPH and 120 LPH. The pressure drop across the helical coil and control valve is noted down now air flow rate is changed to 60 LPH. The mixture flow rate is varied to 30 LPH to 120 LPH and the pressure drop across the valve and helical coil are noted down.

Figure 3: A discrete MPC scheme.
This procedure is repeated until the air flow rate is reached 120 LPH level. The combined density of crude oil and water mixture is varied by adjusting stirrer speed and by taking different ratio of crude oil and water in the storage tank. For various combined density of mixture, the above procedure was repeated and the pressure drop data were obtained.
Design of PID and MPC controller
Seven different combined density mixtures (crude oil plus water) were used for testing. Such as 0.89 kg/lit, 0.91 kg/lit, 0.93 kg/lit etc. The above different density of mixture was used in order to obtain different viscosity and different density, more than fifty numbers of tables were prepared for the above seven different mixture (crude oil and water mixture at different density) and corresponding pressure drop across helical coil versus mixture flow rate and pressure drop across the control valve verses mixture flow rate graphs were also drawn. Few number of tables such as Table 1 (for combined density 0.89 kg/lit), Table 2 (for combined density 0.93 kg/lit) and Table 3 (combined density of 095 kg/lit)) are shown below. For each table two graphs were drawn, one for pressure drop across helical coil Vs. mixture flow rate and other for pressure drop across control valve Vs. Mixture flow rate. More than two hundred number of graph were drawn, few graphs Figure. 4 and 5 (for combined density 0.89 kg/lit) Figure. 6 and 7 (for combined density 0.91 kg/lit) Figure. 8 and 9 (for combined density 0.93 kg/lit) are shown below. By using the second order curve fitting corresponding linear equation is obtained (shown inside the graph) By using these linear equations from graphs proper PID controller is designed (4 mA to 20 mA). The output of PID controller is used to control the pneumatic control valve and the air flow rate to maximize the output oil mass flow rate.

Figure 4: Graph between pressure drop across helical coil When the valve opening is 100% and Air flow rate is 90 LPH for crude oil+water+air system (combined density 910 grams per liter).

Figure 5: Graph between pressure drop across control valve when the valve opening is 100% and air flow rate is 90LPH for crude oil+water+air system (combined density 910 grams per litre).

Figure 6: Graph between pressure drop across helical coil when the valve opening is 75% and air flow rate is 120 LPH for crude oil+water+air system (combined density is 930 grams per liter).

Figure 7: Graph between pressure drop across control valve when the valve opening is 75% and air flow rate is 120 LPH for crude oil+water+air system (combined density is 930 grams per liter).

Figure 8: Graph between pressure drop across Helical Coil when the valve opening is 50% and air flow rate is 60 LPH for crude oil+water+air system (combined density is 950 grams per liter).

Figure 9: Graph between pressure drop across control valve when the valve opening is 50% and air flow rate is 60 LPH for crude oil+water+air system (combined density is 950 grams per liter).
| Air Flow Rate Iph | Mixture flow Rate lph | Δh Coil cm | Δh Valve cm | Experimental | Best Fit | % Error | |||||
|---|---|---|---|---|---|---|---|---|---|---|---|
| ΔP Coil N/m2 | ΔP Valve N/m2 | ΔP Total N/m2 | ΔP Coil N/m2 | ΔP Valve N/m2 | ΔP) Total N/m2 | Coil | Valve | ||||
| 60 | 6.2 | 0.3 | 7458.5 | 158.2 | 7616.7 | 7584.2 | 162.4 | 7746.6 | 1.66 | 2.58 | |
| 90 | 6.8 | 0.45 | 7924.6 | 178.4 | 8103 | 8003.2 | 181.2 | 8184.4 | 0.98 | 1.55 | |
| 90 | 120 | 7.3 | 0.75 | 8294.8 | 194.5 | 8489.3 | 8394.5 | 192.4 | 8586.9 | 1.19 | -1.09 |
| 150 | 7.9 | 0.98 | 8745.1 | 238.8 | 8983.9 | 8684.2 | 242.1 | 8926.3 | -0.70 | 1.36 | |
| 180 | 8.24 | 1.18 | 9028.23 | 272.8 | 9301.03 | 9145.2 | 276.5 | 9421.7 | 1.28 | 1.33 | |
Table 1. Readings taken from crude oil-water-air (combined density=0.91 (910 grams/liter)) system when percentage of valve opening is 100% and Air flow rate-90 LPH.
| Air Flow Rate Iph | Mixture flow Rate lph | Δh Coil cm | Δh Valve cm | Experimental | Best Fit | % Error | |||||
|---|---|---|---|---|---|---|---|---|---|---|---|
| ΔP Coil N/m2 | ΔP Valve N/m2 | ΔP Total N/m2 | ΔP Coil N/m2 | ΔP Valve N/m2 | ΔP Total N/m2 | Coil | Valve | ||||
| 60 | 4.9 | 0.2 | 6984.5 | 141.4 | 7125.9 | 7065.8 | 143.2 | 7209 | 1.15 | 1.26 | |
| 90 | 5.4 | 0.42 | 7458.4 | 154.6 | 7613 | 7356.4 | 156.8 | 7513.2 | -1.39 | 1.40 | |
| 120 | 120 | 6.1 | 0.68 | 7856.8 | 181.4 | 8038.2 | 8024.5 | 183.4 | 8207.9 | 2.09 | 1.09 |
| 150 | 6.9 | 0.79 | 8345.6 | 214.2 | 8559.8 | 8495.7 | 213.4 | 8709.1 | 1.77 | -0.37 | |
| 180 | 7.4 | 0.98 | 8862.1 | 250.8 | 9112.9 | 8985.3 | 253.7 | 9239 | 1.36 | 1.14 | |
Table 2. Readings taken from for crude oil-water-Air (combined density=930 grams per liter) system when Percentage of valve opening is 75% and Air flow rate-120 LPH.
| Air Flow Rate Iph | Mixture flow Rate lph | Δh Coil cm | Δh Valve cm | Experimental | Best Fit | % Error | |||||
|---|---|---|---|---|---|---|---|---|---|---|---|
| ΔP Coil N/m2 | ΔP Valve N/m2 | ΔP Total N/m2 | ΔP Coil N/m2 | ΔP Valve N/m2 | ΔP Total N/m2 | Coil | Valve | ||||
| 60 | 3.8 | 0.12 | 5643.6 | 131.7 | 5775.3 | 5784.3 | 132.4 | 5916.7 | 2.43 | 0.52 | |
| 90 | 4.6 | 0.32 | 6121.8 | 142.5 | 6264.3 | 6249.3 | 144.5 | 6393.8 | 2.04 | 1.38 | |
| 60 | 120 | 5.3 | 0.52 | 6432.4 | 172.8 | 6605.2 | 6589.2 | 170.4 | 6759.6 | 2.37 | -1.41 |
| 150 | 5.9 | 0.72 | 6954.7 | 201.2 | 7155.9 | 7046.5 | 204.2 | 7250.7 | 1.30 | 1.4 | |
| 180 | 6.6 | 0.87 | 7451.3 | 241.4 | 7692.7 | 7384.2 | 243.4 | 7627.6 | -0.91 | 0.82 | |
Table 3. Readings taken from crude oil-water-air (combined density 950 grams per liter) system when percentage of valve opening -50% and air flow rate-60LPH
MPC controller
Model predictive control is a complicated and efficient method used now a day in many industrial processes. Model predictive controller always calculates the optimized current time slot and stores the future time slot in the memory. These is done by optimization technique Model predictive controller makes future calculations and make control action, another controller is not having this characteristic. MPC controller calculates the dependent variable changes created by independent variables in the system. In the present model, independent variable is set point (mixture flow rate) dependent variables are opening level of the valve and the air flow rate.
The model predictive controller measures the present dynamic state of the process by using this it will calculate the further changes on the dependent variables in future. According to the constrains of the depended and independent variable it will calculates the changes in dependent variable. It will first make a change in independent variable whenever further changes are required it will calculate again (Figure. 6).
The flow versus pressure drop curve in our system is not linear. But by using second order curve fitting method the pressure drop curves are linearized. So, linear MPC approach is used in this experimental model. In the present work model, predictive controller uses superposition principle to calculate the future changes in independent variables This simplifies the control method in an easier way.
MPC is based on iterative optimization method. Always the changes in the plant are sampled and it is implemented for the short time (done by means of online or on-the fly calculation). State trajectories are calculated by online calculation, by using the cost minimization function. These calculations are implemented and then the changes in the plant state are measured. By using the above method new calculation is done and implemented. The above process is repeated till the desired output value is reached. The above method is called as receding horizon method. A discrete MPC scheme is shown in Figure. 3.
Principle of MPC
Model predictive controller is using the following
• Dynamic model of the process
• It makes use of previous control moves
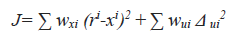
• An optimization cost function J over the receding prediction horizon to calculate the optimize control moves. In this work, we use a nonlinear cost function for optimization is given by
xi= I th controlled variable (flow rate)
ri=I th reference variable (pressure drop)
Ui=I th manipulated variable (opening level of control valve)
Wxi=weighing co efficient reflecting the relative importance of xi
Wui=weighting coefficient penalizing relative big changes in ui etc.,
Result and Discussion
In the present work, many data regarding pressure drop between the helical coil and control valve in series for different air flow rate (30 LPHM, 60 LPH, 90 LPH and 120 LPH) and different opening level of control valve (25%, 50%, 75%, 100%) is measured for various crude oil plus water system.
Graphs were obtained between mixture flow rate and pressure drop. Their characteristic is studied by using linearization method (second order) relationship equations were obtained for the corresponding graphs (They are shown inside the figures). By using the linear equation controller parameter (Kp, Kd, Ki) are obtained and by using these parameter proper MPC and PID controller is designed. The controller will regulate the control valve in the system as well as air flow rate. So, by using the controller the mixture flow rate is increased to the desired value. If we implement these controllers in oil rig extracting rate of the crude oil will increases, the overall efficiency of the oil rig will have increased. In previous studies Research on Three phase oil-water gas horizontal co current flow by Speeding et al. [3] did not design this kind of MPC AND PID controller to maximize the crude oil flow rate.
A general model for single and multiphase flow operations, drilling, completion, well control and intervention proposed a general model for multiphase flow only. They were worked on mass flow rate and operation and control of oil well. They did not design a MPC or any controller to control the process.
A Robust multi-model predictive controller for distributed parameter system worked on designing Model predictive controller for distributed parameter system in general. They did not design such kind of controller for crude oil exploration system. In this work MPC controller is designed for this kind of multi-phase flow system.
Now-a-days, many petroleum and crude oil fields have a natural gas-crude oil separator installed on the output side of each well to separate the natural gas from the crude-oil. After separation of gas they transport the crude-oil to on shore. But this separation process takes a long time and gas-liquid separator is very costlier equipment. By using properly designed MPC and PID controller in this system we can pump out these crude oil-gas-water together and we can increase the crude oil extracting from the oil rig. Petroleum and oil companies have invested billions so improvement of crude oil extracting rate of one or two percentage will efficiently save many millions of dollars to the company. If the overhead charges of the company reduce then oil and gas prices will reduce and it will improve the world economy
Conclusions
Seven different combined density (crude oil plus water) mixture were used in this test method to obtain various data such as pressure drop between the helical coil and control valve. Proper of model predictive controller and PID controller are designed. The controller will control the air flow rate of the system and it will control the opening levels of the control valve there by the overall mixture flow rate is increased. By using these controller in the oil rig, we can increase the crude oil extracting rate and thus we can improve the efficiency of the oil rig.
Using the pressure drop curves and linear equation obtained from the test proper model predictive controller and PID controller are designed and shown in Figure. 10, which is controlling the valve opening and air flow rate and improve the extraction rate of crude oil from the rig.

Figure 10: Shows the proposed design of PID and MPC Controller for controlling the three-phase flow through helical coil and control valve.
References
- Decarre S, Duret E, Tran QH. Oil water gas study in pipe, paper 320. International conference on multiphase flow, New Orleans. 2001.
- Wegmann A, Melke J, Rohr RV. Three-phase liquid-liquid-gas f lows in 5.6 mm and 7 mm inner diameter pipes. Int J Multiph Flow. 2007;33:484-97.
- Spedding PL, Donnelly GF, Cole JS. Three phase oil-water-gas horizontal co-current flow: I. Eexperimental and regime map. Chem Eng Res Design. 2005;83:401-11.
- Chen X, Guo L. Flow patterns and pressure drop in oil-air-water three-phase flow through helically coiled tubes. Int J Multiph Flow. 1999;25:1053-72.
- Zhang HQ, Wang Q, Sarica C, et al. Unified mode for gas-liquid pipe flow via slug dynamics-part 1: Model development. J energy resour technol. 2003;125:266-73.
- Tran QH, Masella JM, Ferre D, et al. Transient simulation of two phase flow in pipes. Int j multiph flow. 1998;24:739-55.
- Desalis J, Heintze E. Dynamic simulation of multiphase pumbs.9th BHRG multiphase international conference, cannes, France. 1999;11-43.
- Peterson J, Rommetveit R, Bjerkevoll KS, et al. A general dynamic model for single and multiphase flow operations during drilling, completion, well control and intervention. In: IAPC/SPE Asia pacific drilling technology conference and Exhibition. Society of petroleum engineers, Jakarta, Indonesia. 1999.
- Mann GKI, Hu BG, Gosine RG. Time-domain based design and analysis of new PId tuning rules. Proc Inst Elect Eng control theory appl. 2001;148:251-61.
- Zhuang M, Atherton DP. Automatic tuning of optimum PID Controllers. IEE Proceedings-Part D; Control theory and applications. 1993;140:216.
- Nikolaou M. Model predictive controllers: A critical synthesis of theory and industrial needs, advances in chemical engineering, Academic Press. 2001;26:131-204.
- García MR, Vilas C, Santos LO. A robust multi-model predictive controller for distributed parameter systems. J Proc Control. 2012;22:60-71.
- Acikgoz M, Franca F, Lahey RT. An experimental study of three-phase flow regimes. Int j multiph flow.1992;18:327-36.
