Original Article
, Volume: 15( 4)A Comparative Study on Photocatalytic Activity of ZnO, SnO2 and ZnO-SnO2 Composites
- *Correspondence:
- Basant Kumar Menariya, Department of Chemistry, Pacific University, PAHER Society, Udaipur, Rajasthan, India, Tel: 9785980880; E-mail: basant.menaria@gmail.com
Received: July 18, 2017; Accepted: August 09, 2017; Published: August 14, 2017
Citation: Menariya BK, Ameta R, Ameta SC. A Comparative Study on Photocatalytic Activity of ZnO, SnO2 and ZnO-SnO2 Composite. In J Chem Sci 2017;15(4):174
Abstract
A comparative study was made on photocalytic activity of ZnO, SnO2 and their composite. A simple mechanochemical method was used for preparation of composite. The photocatalytic efficiency of ZnO-SnO2 composite was compared with pure ZnO and SnO2. The effect of various parameters such as pH, dye concentration, semiconductor amount and light intensity was observed. The optimum conditions for this degradation were obtained as: Rose Bengal=6.0 × 10⁻⁶ M, pH=7.5, amount of composite=0.08 g and light intensity=60.0 mWcm-2. It was found that coupled chalcogenide ZnO-SnO2 show better photocatalytic activity as compared with ZnO and SnO2 alone for the degradation of rose Bengal in the presence of visible light.
Keywords
ZnO; SnO2; Composites; Photocatalytic activity; Rose Bengal
Introduction
One of the most essential parts of life is clean water and today, the whole world is facing serious problem of water pollution. Dye effluents of various textile and paper industries are one of the important pollutants. In this era of rapid industrialization, the problem of degradation of pollutants has reached an alarming situation from ecological point of view.
There are many techniques for eliminating these water pollutants. Many researchers have tried to overcome this problem by methods like adsorption by charcoal, precipitation, air stripping, flocculation, thermal dehydration, etc., Photocatalyst may play significant role in solving this problem. Different methods based on it have proved their worth as these are green and affectionate in nature.
Ameta et al. [1,2] have excellently reviewed the field of photocatalysis. Several photocatalysts have been used for the degradation of different dyes from their aqueous solutions. Photocatalytic oxidative degradation of wastewater pollutants in aqueous suspensions of TiO2 was observed by Das et al. [3] They observed that certain organic molecules (polynuclear aromatic hydrocarbons) adsorbed on TiO2 could be reduced with the concomitant oxidation of water. Mansilla and Villasnov [4] investigated the ZnO catalysed photodegradation of Kraft-black liquor, a discharge from the paper and pulp industries. Photocatalytic degradation of amaranth dye on TiO2/UV in aqueous suspensions has been studied by Gupta et al. [5].
Vidya et al. [6] synthesized nanoparticles of zinc oxide by using leaf extract of jackfruit (Artocarpus heterophyllus). These nanoparticles exhibited excellent photodegradation efficiency (>80%, 0.24 g/L, 1 h) against rose Bengal dye, a major water- pollutant discharged by the textile industries. Degradation of rose Bengal and methylene blue dye using γ-Fe2O3 nanoparticles as a photocatalyst was reported by Dutta et al. [7] Ag-ZnO catalysts by flame spray pyrolysis (FSP) was prepared by Height et al. [8] Methylene blue was used as model system to evaluate the performance of FSP-made Ag-ZnO. Faisal et al. [9] synthesized SnO2 doped ZnO nanostructure photocatalyst. As synthesized SnO2 doped ZnO nanostructures have been used for photodegradation of methylene blue under visible light. Bhattacharjee et al. [10] developed SnO2 quantum dots by microwave heating method using an amino acid, serine and eosin yellow was degraded by this catalyst. Photodegradation of methyl orange using nanosized coupled ZnO/SnO2 photocatalysts investigated by Cun et al. [11].
Mittal et al. [12] studied photocatalytic bleaching of rose Bengal on manganese dioxide powder. Nanostructured semiconductor films of SnO2, TiO2 and SnO2-TiO2 were prepared by Vinodgopal et al. [13] and used for photocatalytic degradation of NBB, a textile azo dye. TiO2-assisted photodegradation of eosin has been examined by Zhang et al. [14] ZnS has been used for the photoreduction of carbon dioxide by Kanemoto et al. [15] Anpo et al. [16] gave evidence for the involvement of extrinsic surface sites in the enhancement of the photocatalytic activity of luminescent ZnS catalyst. Ameta et al. [17] used antimony trisulphide for the photodegradation of naphthol green B. A composite polycrystalline ZnO/TiO2 system and its photocatalytic activity was reported by Marci et al. [18] Kansal et al. [19] studied photocatalytic degradation of methyl orange and rhodamine 6G using various semiconductors such as titanium dioxide, zinc oxide, stannic oxide, zinc sulphide and cadmium sulphide. Azure B was photocatalytically degraded by Sharma et al. [20] using NiS-ZnS composite in molar ratio 1:5.
Experimental Procedure
Preparation of composite
A composite of ZnO and SnO2 was prepared by simple solid state mechanochemical method. Composite (ZnO-SnO2) was prepared by mixing the equal amount of ZnO and SnO2 (1:1 ratio) and then ground with the help of pestle and mortar and it was used for photocatalytic degradation of rose bengal.
Characterization of composite
X-rays diffraction pattern of the pure ZnO-SnO2 composite is shown in Figure 1. Average particle size of the crystalline composite powder was calculated by Debye-Scherrer’s equation and it was found 97.25 nm.

Figure 1: X- ray diffraction spectrum of composite.
The surface morphology and elemental composition were observed out by scanning electron microscope equipped with an energy dispersive X-ray spectrophotometer. The SEM image of ZnO-SnO2 composite is Figure 2. It shows that particles have rough surface with irregular size.

Figure 2: SEM of composite.
EDX analysis was performed to analyze the elemental constituent of mixed ZnO-SnO2. It was observed that three elements are present in nanomaterial i.e., Zn, Sn and O (Table 1).
| Elements | Weight (%) | Atomic (%) |
|---|---|---|
| Zn | 50.75 | 28.88 |
| Sn | 20.69 | 8.35 |
| O | 50.75 | 62.75 |
Table 1: Elemental composition.
Photocatalytic degradation
0.1017 g rose Bengal was dissolved in 100.0 mL of doubly distilled water to prepare 1.0 × 10⁻³ M concentration solution. It was used as a stock solution and further diluted as working solutions when required. The absorbance of rose Bengal solution was observed with the help of spectrophotometer (Systronic model 106) at λmax=550 nm. It was irradiated with a 200 W tungsten lamp (CEL, Model SM 201) Reaction solution was exposed to visible light. A water filter between light source and solution was used to cut off the thermal radiation.
Equal amount of dye solution was kept in four beakers.
1. The first beaker of rose Bengal dye solution was placed in dark.
2. The second beaker of rose Bengal dye solution was exposed to visible light.
3. The third beaker of rose Bengal dye solution and 0.10 g ZnO-SnO2 composite was placed in dark.
4. The fourth beaker of rose Bengal dye solution and 0.10 g ZnO-SnO2 composite was exposed to visible light.
After 3 hours absorbance of solution was measured by spectrophotometer. The absorbance of first three beaker solution was found almost constant but the absorbance of the solution of fourth beaker had a decrease compared to initial value of absorbance. From all this observation, it is clear that the degradation required the both: light intensity and semiconductor composite.
The photocatalytic degradation of rose Bengal dye was studied, after addition of 0.08 g of composite in 50 mL dye solution (6.0 × 10⁻⁶ M) at pH 7.5. A 200 W tungsten lamp was used for irradiation (60.0 mW cm-2 light intensity). A glass vessel was used for irradiation. A solarimeter (Suryamapi CEL 201) was used for the measurement of light intensities. Water filter was used to cut thermal effect. pH of the dye solutions was measured using a digital pH meter. pH of the dye solutions was adjusted by addition of previously standardized 0.1N sulphuric acid and 0.1 N sodium hydroxide solution. UV-Visible spectrometer (Systronic Model 106) was used to measure absorbance (A) of the dye solution at regular time intervals. Controlled experiments were also carried out to confirm that the degradation of rose Bengal by ZnO-SnO2 was photocatalytic in nature. A linear line plot of 1 + log A and time shows that rose Bengal degradation follows pseudo-first order kinetics.
The following formula was used to calculate the rate constant.
k=2.303 × slope (1)
Results and Discussion
Effect of pH
The pH of the solution always affects the degradation of any dye solution and hence (Table 2), pH of the rose Bengal dye solution was varied and the rate of photocatalytic degradation was measured in the pH range 6.0-10.0, as the degradation was found to be reasonably rapid in this range. pH effect results are reported in Table 3. It was found that the rate of photocatalytic degradation had an increase with increase in pH up to a certain pH value, the rate constant was found optimum at pH 7.5; more increase in pH, rate of reaction gradually reduced. An increase in the photocatalytic activity with increase in pH may be due to formation of extra •OH radicals, which are generated from the interaction of OH− and hole (h+) of the composite semiconductor. These •OH radicals are accountable for the oxidative degradation of dye. The rate reduces after certain pH because more hydroxyl ions are available at higher pH and these will be adsorbed on the surface of the semiconductor, which makes it negatively charged so that the approach of anionic form of rose Bengal towards semiconductor surface will be slowed due to repulsion, which results decrease in the rate of degradation.
| [Rose Bengal]=6.0 × 10⁻⁶ MpH=8.5 | ||
|---|---|---|
| Amount of composite=0.08 gLight intensity=60.0 mWcm-2 | ||
| Time (min.) | Absorbance (A) | 1 + log A (ZnO-SnO2) |
| 0 | 0.528 | 0.7226 |
| 10 | 0.433 | 0.6365 |
| 20 | 0.395 | 0.5966 |
| 30 | 0.353 | 0.5478 |
| 40 | 0.318 | 0.5024 |
| 50 | 0.285 | 0.4548 |
| 60 | 0.248 | 0.3945 |
| 70 | 0.208 | 0.3181 |
| 80 | 0.184 | 0.2648 |
| 90 | 0.162 | 0.2095 |
| 100 | 0.141 | 0.1492 |
Rate constant (k) with ZnO=1.41 × 10⁻⁴ sec-1
Rate constant (k) with SnO2=1.32 × 10⁻⁴ sec-1
Rate constant (k) with ZnO-SnO2=2.17 × 10⁻⁴ sec-1
Table 2: A typical run.
| [Rose Bengal] =6.0 × 10⁻⁶ M | Light intensity =60.0 mWcm-2 |
|---|---|
| Amount of composite=0.08 g | |
| pH | Rate constant (k) × 104 (sec-1) |
| 6.0 | 1.87 |
| 6.5 | 2.00 |
| 7.0 | 2.11 |
| 7.5 | 2.17 |
| 8.0 | 1.80 |
| 8.5 | 1.63 |
| 9.0 | 1.63 |
| 9.5 | 1.50 |
| 10.0 | 1.42 |
Table 3: Effect of pH.
Effect of dye concentration
Different concentrations i.e., 0.2-1.4 × 10⁻⁵ M of rose Bengal dye was used to study the effect on rate of photocatalytic degradation. The results are tabulated in Table 4. It was identified that the rate of photocatalytic degradation increases with an increase in dye concentration. The reason behind it, as the concentration of dye was increased additional dye molecules are available for excitation and energy transmission and hence, an upsurge in the rate of photocatalytic degradation of the rose Bengal dye was observed. The rate of photocatalytic degradation decreased with more increase in the concentration of the dye. The rate constant was found optimum at 6.0 x 10⁻⁶ M for rose Bengal. This may be due to the fact that after certain dye concentration, the dye itself starts acting as a filter for the incident light and it will not allow the favoured light intensity to reach the semiconductor particles; thus, decreasing the rate of photocatalytic degradation of dye.
| pH =7.5 | Light intensity =60.0 mWcm-2 |
|---|---|
| Amount of composite=0.08 g | |
| [Rose Bengal] × 105 M | Rate constant (k) × 104 (sec-1) |
| 0.2 | 1.91 |
| 0.4 | 1.99 |
| 0.5 | 2.07 |
| 0.6 | 2.17 |
| 0.7 | 1.85 |
| 0.8 | 1.64 |
| 1 | 1.45 |
| 1.2 | 1.24 |
| 1.4 | 0.98 |
Table 4: Effect of dye concentration.
Effect of amount of semiconductor (ZnO-SnO2) composite
The quantity of semiconductor is also affect the rate of photocatalytic degradation of rose Bengal dye and hence; different amounts i.e., 0.02-0.14 g of semiconducting composite were used. The results are tabulated in Table 5. This study showed that the rate of photocatalytic degradation of rose Bengal increases with an increase in the amount of composite but finally, it became almost constant after a certain amount i.e., 0.08 g for ZnO-SnO2 composite. The possible reason may be as the amount of composite was increased, the exposed surface area is also increased. As a consequence, the rate of photocatalytic degradation of the dyes increased, but after a fix limit, if the amount of semiconductor was more increased, then there was no increase in the exposed surface area of the composite. It can be considered like a saturation point; further increase in the amount of semiconductor has insignificant or no effect on the rate of photocatalytic degradation of the rose Bengal dye, as any increase in the quantity of semiconductor after this saturation point will only increase the thickness of the film at the lowermost of the reaction vessel. This was confirmed by taking reaction vessels of different sizes. The saturation point shifts to higher range for greater vessels, while reverse was true for smaller vessels.
| [Rose Bengal] =6.00 × 10⁻⁶ M | pH=7.5 |
|---|---|
| Light intensity = 60.0 mWcm-2 | |
| Amount of Composite (g) | Rate constant (k) × 104 (sec-1) |
| 0.02 | 0.84 |
| 0.04 | 1.18 |
| Amount of Composite (g) | Rate constant (k) × 104 (sec-1) |
| 0.06 | 1.50 |
| 0.08 | 2.17 |
| 0.10 | 2.14 |
| 0.12 | 2.13 |
| 0.14 | 2.13 |
Table 5: Effect of photocatalyst.
Effect of light intensity
Light intensity was varied to observe the effect of intensity of light on the photocatalytic degradation of the dye. The results are tabulated in Table 6. The data shows that an increase in the light intensity increases the rate of reaction and the optimum value was found at 60.0 mWcm-2. It may be due to the fact as the light intensity was increased, the number of photons striking per unit area also increased, causing higher rate of degradation. Further increase in the light intensity beyond the optimum limit result in decrease in the rate of reaction. It may be probably due to thermal side reactions.
| [Rose Bengal] =6.0 × 10⁻⁶ M | pH=7.5 |
|---|---|
| Amount of composite=0.08 g | |
| Light intensity (mW cm-2) | Rate constant (k) × 104 (sec-1) |
| 20.0 | 0.78 |
| 30.0 | 0.93 |
| 40.0 | 1.09 |
| 50.0 | 1.24 |
| 60.0 | 2.17 |
| 70.0 | 1.54 |
Table 6: Effect of light intensity.
Mechanism
On the basis of all these observations, a tentative mechanism for degradation of rose Bengal (Dye) is proposed as follows:
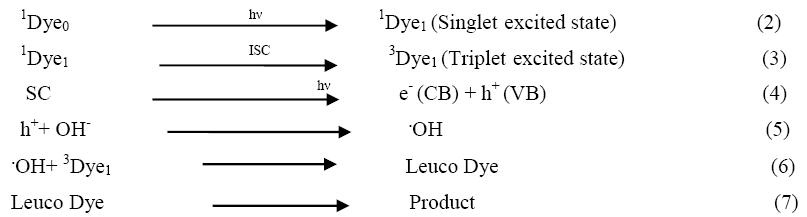
Rose Bengal absorbs radiations of appropriate wavelength and converted to its excited singlet state. Then it undergoes intersystem crossing (ISC) to give the triplet state of the dye. Besides, the semiconducting composite ZnO-SnO2 also used the incident visible light energy to excite its electron from valence band to conduction band; thus, leaving behind a hole. This hole may abstract an electron from OH- ions to generate •OH radicals. These •OH radicals will then oxidize the dye to its leuco form, which may finally degrade to less toxic yields. The participation of hydroxyl radicals as an active oxidizing species was confirmed by using hydroxyl radical scavengers (isopropanol), where the rate of degradation was completely reduced.
Conclusion
A comparative study has been carried out between photocatalytic activity of pure ZnO and SnO2 and their composite. Rose Bengal dye was used as a model system to compare their photocatalytic performance. The rate constants for photocatalytic degradation of rose Bengal using ZnO, SnO2 and ZnO-SnO2 were 1.41 × 10⁻⁴ sec-1, 1.32 × 10⁻⁴ sec-1 and 2.17 × 10⁻⁴ sec-1, respectively. These results clearly show that the composite ZnO-SnO2 showed better activity as compared to individual ZnO and SnO2. The observation of present work will explore the use of composites in enhancing photocatalytic performance of a photocatalyst.
References
- Sahasi S, Jain NK, Dak M, et al. Heterogeneous and homogeneous photocatalysis.Part I:Inorganicsubstrates. Asian JChem Rev. 1991;2:90-9.
- Ali Z, Ameta R, Vardia J, et al.Photocatalysis: A frontier of photochemistry. J Indian Chem Soc. 1991;78:281-7.
- Das S, Munner M, Das KRG.Photocatalyticdegradation of wastewater pollutants. Titanium-dioxide-mediated oxidation of polynuclear aromatic hydrocarbons. J PhotochemPhotobiol A: Chem. 1994;77:83-8.
- Mansilla HD, Villasenor J,Maturana G.ZnO-catalysedphotodegradationof Kraft black liquor. J PhotochemPhotobiol A: Chem. 1994;78:267-73.
- Gupta VK, Jain R, Mittal A, et al. Photo-catalytic degradation of toxic dye amaranth on TiO2/UV in aqueous suspensions. Mater Sci Eng. 2012;32:12-7.
- Vidya C, Chandraprabha MN, Antony Raj MLA. Green mediated synthesis of zinc oxide nanoparticles for the photocatalytic degradation of Rose Bengal dye.Env Nano Monitor Manage. 2015;6:134-8.
- Dutta K, Maji SK,Adhikary B. γ-Fe2O3 Nanoparticles: An easily recoverable effective photo-catalyst for the degradation of rose bengal and methylene blue dyes in the wastewater treatment plant. Mater Res Bull. 49, 28-34 (2014).
- Height MJ, Pratsinis SE, MekasuwandumrongO, et al. Ag-ZnOcatalysts for UV-photodegradation of methylene blue.ApplCatal B: Environ. 2006;63:305-12.
- Faisala M, Ibrahima AA, Harraza FA, et al. SnO2doped ZnOnanostructures for highly efficient photocatalyst. J MolCatal A: Chem. 2015;397:19-25.
- Bhattacharjee A,Ahmaruzzaman M. Facile synthesis of SnO2quantum dots and its photocatalytic activity in the degradation of eosin Y dye: A green approach. J Colloid Interf Sci. 2015;448:130-9.
- Cun W, Xinming W, Bo-Qing X, et al. Enhanced photocatalytic performance of nanosized coupled ZnO/SnO2photocatalysts for methyl orange degradation. JPhotochemPhotobiol A: Chem. 2004;168:47-52.
- Mittal N, Shah A, Punjabi PB,et al. Photodegradation of Rose Bengal using MnO2 (Manganese Dioxide).Rasayan J Chem. 2009;2:516-20.
- Vinodgopal K, Bedja I,Kamat PV. Nanostructured semiconductor films for photocatalysis. Photoelectrochemicalbehavior of SnO2/TiO2composite systems and its role in photocatalytic degradation of a textile azo dye.Chem Mater. 1996;8:2180-7.
- Zhang F, Zhao J, Hidaka H, et al. TiO2-Assisted photodegradation of dye pollutants II. Adsorption and degradation kinetics of eosin in TiO2dispersions under visible light irradiation.ApplCatal B: Environ. 1998;15:147-56.
- Kanemoto K, Shiragoni J, Pac C, et al. Effective photoreduction of carbon dioxide catalyzed by zinc sulfide quantum crystallites with low density of surface defects. J Phys Chem. 1992;96:3521-6.
- Anpo M, Malsumoto A, Kodama S.Direct evidence for the participation of extrinsic surface sites in the enhancement of photocatalytic activity of luminescent zinc sulphide catalysts. J Chem Soc. ChemCommun. 1038-9.
- Ameta R, Punjabi PB, Ameta SC.Photodegradation of naphthol green B in the presence of semiconducting antimony tri sulphide. J Serb Chem Soc. 2011;76:1049-55.
- Marci G, Augugliaro V, Lopez-Munoz MJ, et al. Preparation characterization and photocatalytic activity of polycrystalline ZnO/TiO2systems. J PhysChem B.2001;105:1026-32.
- Kansal SK, Singh M, Sud D. Studies on photodegradation of two commercial dyes in aqueous phase using different photocatalysts. J Hazard Mater. 2007;141:581-90.
- Sharma V, Gandhi N, Khant A, et al. Enhanced photodegradation of azure b by co-precipitated NiS-ZnS (1:5).Int J Chem Sci. 2010;8:1965-72.
