Original Article
, Volume: 6( 2)Simulation of Hyper-Velocity Impact of a Micro-Particle on Layered Shield Configurations
- *Correspondence:
- Govind G School of Mechanical and Aerospace Engineering, Nanyang Technological University, Singapore 639798, Singapore
Tel: +6567911744; E-mail: GOVIND001@e.ntu.edu.sg
Received Date: March 13, 2017 Accepted Date: May 17, 2017 Published Date: May 22, 2017
Citation: Govind G. Simulation of Hyper-Velocity Impacts of Micro-Particle on Layered Shield Configurations. J Space Explor. 2017;6(2):123.
Abstract
A Numerical investigation is carried out to assess the performance of layered shield configurations against hypervelocity impact of a micro-particle nominally travelling at the velocity of a 7.3 km/s. Most micro-particles in space either consist of or possess characteristics similar to aluminum, float glass, and steel particles. Therefore, these three materials are used in this numerical investigation as impactors shielded by a layered configuration. A two-foil shield configuration is modelled using aluminum as the first and Ti-6Al-4V as the second bumper foils. The simulated impact scenarios have consistent dimensions with the micro-particle diameter, the first foil thickness and the second foil thickness measuring 47μm, 8μm, 15μm respectively. The numerical analysis of the impact events was performed using smooth particle hydrodynamic processor in AUTODYN hydrocodes, and the material modelling was accomplished using an equation of state with constitutive strength and the cumulative damage model. The present studies have shown that the layered shield configuration considered can be effective against the impact of aluminium and float glass micro-particles. A one mm thick, Ti-6Al-4V plate, however, is additionally needed into the shield configuration at 5 mm distance from the second foil to withstand the impact of rigid micro-particles, such as of steel.
Keywords
Hypervelocity impact; Space debris; Micrometeoroids; Smooth particle hydrodynamics
Introduction
Ever since the first man-made satellite “Sputnik”, launched in 1957, continual human endeavors to explore space led to a drastic increment in space missions, resulting in accumulation of floating debris and micro-particles. This has made space exploration unsafe due to an increased risk of collision with such space debris (SD). The long duration exposure facility (LDEF) was struck more than 34,000 times by meteoroids and debris during its 5.7 years flight [1]. The space station has also been struck by tens of thousands of debris larger than 0.1 mm. A study indicated that 10 cm diameter SD travelling at 10 – 15 km/s has a potential to destroy a one-ton satellite [2]. To evaluate this serious issue, space organizations around the world have been continuously scrutinizing outer space to predict the SD population. According to a report [3], SD and micro-meteoroids (MM) are posing a great threat to the space access programs. This report organized the data of the space junk and classified it based on its size. Today, SD exists in the magnitude of trillions in outer space, but only a small portion is marked due to the limitation in the tracing capability from the Earth. This calls for effective strategies to protect satellites and spacecraft against SD and MM. Among various methods, the first is an active method, in which on board system identifies the threat at a specified distance so that an evasive maneuver of the spacecraft can be performed. The second method is a passive method, in which the satellites and space probes parts are protected by implementing additional layers of materials, which act as a shield against impacts of SD or MM. This method offers better reliability regarding response and sustainability.
The first passive shield configuration was a two-plate configuration proposed by Whipple [4]. The shield design consisted of a front layer (bumper) and a rear wall placed at a certain distance in between. The front layer promotes explosion of impacting particles into a spray of smaller fragments. After the successful implementation of this configuration, many researchers [1,5-15] proposed different improved configurations, such as triple wall, honeycomb sandwich panel, multi-shock shield, mesh double bumper shield, stuffed Whipple shield, topological modified bumper shield, single bumper shield and flexible bumper shield, etc., to use against the hyper velocity impacts (HVI).
Firstly, testing of any shield configurations for HVI in the laboratory requires the generation of HVI scenario similar to those found in outer space. Secondly, very few facilities are equipped with dust accelerator, have limited capability and HVI tests are usually expensive. The measurement of the structure behavior under dynamic loading is an onerous task [16]. The experimental setup is quite expensive and requires specialist training for precise operation. To solve this problem, many inhouse analytical and simulation tools have been developed by space agencies and defense organizations The two main features, which shall be considered while dealing with HVI phenomena are, the inertial effects in governing equations and transient phenomenon [17]. Commercial hydrocodes are now available; for example, LS-Dyna, MSC-Dytran, ANSYSAUTODYN® can cater to high-velocity events simulation [18-20]. The current work presents a numerical approach that provides in-depth understanding and analysis of the performance of layered shield configurations against HVI of micro-sized SD. The geometry of the investigated MP and shield configuration is based on a work at TU Munich [21]. The present study encompasses numerical procedure for analyzing response of two-foils shield configurations against hypervelocity impact of microparticles (MP) made of three different materials. Further, it describes kinematic and geometric parameters of the debris clouds that consist of fragments from the MP and the shielding foils.
Theoretical background
The impact of microparticle (MP) is a transient event which involves the excessive deformation and thermal softening. It is important to consider the dominating forces, inertial effects and phase transition. There are two main types of stresses which dominate the deformation mechanism namely: hydrostatic and deviatoric and it can be expressed as Equation (1).
 (1)
(1)
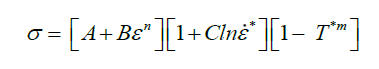
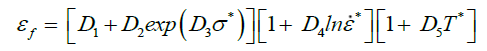
In Equation (1), it is the combination of hydrostatic stress (volumetric stress) and deviatoric stress (accounting for the change in shape of materials under loading condition). Many computational facilities and hydrocodes have been developed over a period to predict the response of materials under extreme dynamic loading conditions accurately. Jonhson-Cook (JC) constitutive strength model has been used to describe a numerical modelling of the metal [22]. The first square bracket term expresses the stress as the function of an equivalent plastic strain. The second and third bracket terms represent stain rate sensitivity and thermal softening of the material respectively. This equation combines the flow stress (σ) in the metal as the function of the plastic strain, along with the high stain rate effect.
The JC equation (2) constitutes of parameters, A, the initial yield stress, B, the strain hardening constant and C, strain rate sensitivity constant. In Equation (2), dimensionless plastic strain rate which is ratio of the strain rate to user defined reference strain rate. T*m considers the thermal softening effect on to the material.
 (2)
(2)
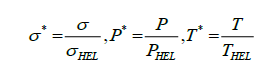
Equation (3) is a Johnson-Holmquist (JH) material model, a phenomenological constitutive, combining strength, polynomial equation and a damage model to replicate the brittle material (i.e. the float glass). It indicates increase in the strength of brittle materials due to the hydrostatic pressure. The JH model uses normalized parameters and is presented as:
 (3)
(3)
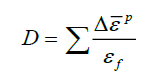
Failure modelling of the metal has been performed using cumulative damage model developed by Johnson–Cook. Similar to the consititutive strength model, it combines the influence of stress triaxiality, temperature and strain rate on the failure strain. The equivalent failure strain can be expressed as Equations (4):
 (4)
(4)
In Equation (4) 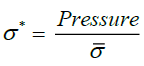 [23]. In Equation (5), when D approaches 1, the failure occurs.
 (5)
(5)
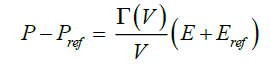
In a two-foil configuration, interaction of MP with the first foil induces a shock wave (compressive wave) that travels from the MP to the rear surface of the foil. Once it reaches to the back of the foil, the compressive wave reflects as the tensile wave causing fragmentation at the back of the foil. To take account of the hydrostatic stress in the metal foil material, an equation of state (EOS) is used. Equation (6) is the general form of Mie-Gruneisen formulation depicting the effect of pressure on material’s density, and internal energy. It provides information on shock loading and unloading effects on materials under HVI and temperature effects due to the shock unloading.
 (6)
(6)
During the hypervelocity impact phenomena on a solid, the pressure dominates the deviatoric stresses. In equation (6), P , is the pressure, Pref , the pressure on the reference curve, E is the specific internal energy, Eref , the specific internal energy on the reference curve, V is the specific volume, and  is the Gruneisen function.
Numerical simulation
The following section will explain the geometry of the microparticle and thin foils along with standoff distance. It will also present the selection of the material for MP, foils and a brief on the FEM procedure. The geometry of the investigated MP and shield configuration is based on a work at TU Munich [21].
The numerical model
The immediate Earth space comprises of microparticle/s (MP) from manmade objects, micrometeoroids (MM), and space dust that continuously revolve with the surrounding. However, it is a difficult task to have mechanical properties of the MP to represent the MP characteristics in numerical domain. For the present study three types of material are used to represent the MP namely: Aluminum, float glass and steel 4340. These three types of the material cover the combined effect of brittle, and rigid materials. The geometric selection of the projectile and multiple foils thicknesses has been selected based on the carried work by Dr. Martin Rott at TU Munich, Germany and the actual experiments were carried on the polymeric film against to the brittle projectile [21]. Table 1. contains information on the geometrical parameter of the numerical setup as follows: the first foil (aluminum) has the radius of 0.20 mm and the thickness of 8 μm, while the second foil (titanium) is 15 μm thick and 5 mm in radius. The distance between the foils is 5 mm. The microparticle (MP) is spherical with 47 μm in diameter and travelling at 7.3 Km/s.
| Micro-particle’s radius | 0.0235 mm | |
| First foil’s thickness | 0.008 mm | |
| Radius of first foil | 0.20 mm | |
| Second foil’s thickness | 0.015 mm | |
| Radius of second foil | 5.0 mm | |
| Micro-particle’s velocity | 7.3 km/s | |
| Micro-particle mass | ||
| Al-2024T3 | 1.51 10-4 mg | |
| Float glass | 1.37 10-4 mg | |
| Steel | 4.21 × 10⁻⁴ mg | |
Table 1. Details of the shield configuration.
Space grade materials are required to pass specific tests and procedure to be applicable for space missions, which operate in a vacuum. Such material shall exhibit excellent strength, thermal and electrical properties, and characteristics to meet the requirements of the space environment. Aluminum and titanium alloys always have been an integral part of spacecraft structure as they meet all requirements for space including resistance to sublimation and outgassing [24]. Therefore, for the modelling purposes in the current study, Aluminum-T2024 is selected for the first bumper foil and the second foil is modelled with Ti-6Al-4V as shown in Figure. 1.

Figure 1: The basic impact shield configuration used for numerical studies.
Table 2. comprises cases studied in numerical analysis. In the numerical modelling, the radius of the foils was reduced to minimize the computational time and cost. In the AUTODYN®, 2D axisymmetric model is used to represent the shielding setups.
| Cases | Micro-particle | First foil | Second foil | Witness plate | Distance |
|---|---|---|---|---|---|
| 1 | Al-2024-T3 | Al-2024-T3 | Ti-6Al-4V | Not Used | 5 mm |
| 2 | Float Glass | Al-2024-T3 | Ti-6Al-4V | Not Used | 5 mm,10 mm |
| 3 | Steel 4340 | Al-2024-T3 | Ti-6Al-4V | Ti-6Al-4V | 5 mm each |
Table 2. Configuration details of multiple foils shield.
Numerical modelling procedure
HVI, being a transient phenomenon, the interaction time of impacting MP and the shield configuration is very small. This implies that the deformation is highly localized unlike low-velocity impact and focusing on a smaller zone around the impactor is enough. ANSYS AUTODYN® is used to discretize the shielding and MP configuration because it can be coupled with equations of mass, momentum or energy conservation and the material description to provide time-dependent history of the geometrical and material nonlinearities. The package is integrated with smooth particle hydrodynamic (SPH) processor which enables to simulate problems involving excessive deformation [25]. It avoids mesh distortion, mesh tangling problems that are more likely to occur due to excessive deformation. It does not require erosion algorithm to avoid high deformation [26]. In SPH technique, shapes or geometries are defined with the collection of particles or points instead of nodes and elements. The value of any particle of interest can be computed by summing up of contribution of neighboring particle functions. As the deformation progresses, the particles move along with it and the position of neighboring particles changes accordingly. The particles approximation is performed at every time step in the simulation. Smoothing length plays a vital role in the accuracy and efficiency of this method. The material’s behavior under dynamic loading is modelled using JC formulation (Equation 2) for metal, JH model for brittle material (Equation 3) coupled with cumulative damage law (Equation 5). Under such extreme condition, the materials will undergo a phase transition and replicate this behavior, EOS (Equation 6) is used. Table 3 contains the coefficients used in the simulation work; these parameters have been computed at high strain rate [27-30].
| JC-Parameters | Al-2024T3 | Steel 4340 | Ti-6Al-4V | JC-Damage Parameters | Al-2024T3 | Steel 4340 | Ti-6Al-4V | ||
|---|---|---|---|---|---|---|---|---|---|
| A (MPa) | 369 | 1430 | 1098 | D1 | 0.13 | 0.05 | -0.09 | ||
| B (MPa) | 684 | 2545 | 1092 | D2 | 0.13 | 3.4 | 0.25 | ||
| n | 0.73 | 0.70 | 0.93 | D3 | -1.5 | -2.12 | -0.50 | ||
| C | 0.0083 | 0.014 | 0.014 | D4 | 0.011 | 0.002 | 0.014 | ||
| m | 1.7 | 1.03 | 1.1 | D5 | 0 | 0.61 | 3.87 | ||
| Linear Shock EOS | |||||||||
| Al-2024-T3 | Steel-4340 | Ti-6Al-4V | |||||||
| Gruneisen Coefficient | 2.0 | 1.67 | 1.230 | ||||||
| Parameter C1 | 5328 m/s | 4578 m/s | 5130 m/s | ||||||
| Parameter S1 | 1.338 | 1.33 | 1.0280 | ||||||
Table 3. Johnson-cook strength and damage parameters.
Float glass material properties are obtained from AUTODYN® material library itself. The material’s strength and damage coefficients are listed in Table 4 [25].
| JH Strength Model Parameters | Density | 2.530 g/cm3 | JH Failure Model Parameters | Hydro Tensile Limit | -1.50 e5 kPa |
| Shear Modulus | 30.4 GPa | Damage Constant D1 | 0.05300 | ||
| HEL | 5.95 GPa | Damage Constant D2 | 0.8500 | ||
| Constant A | 0.930 | Bulking constant ß | 1.0 | ||
| Exponent N | 0.770 | Polynomial EOS Parameters | |||
| Strain Rate C | 0.00300 | ||||
| Constant B | 0.08800 | ||||
| Exponent | 0.0350 | Bulk modulus A1 | 45.4 GPa | ||
| Strength ratio | 0.500 | Parameter A2 | -138 GPa | ||
Table 4. Float Glass JH Strength and Failure parameters
The contact between the MP and the shield configuration is defined as external gap interaction. The minimum gap size between two Lagrangian parts without joining is determined to be 1/10th of the minimum particle’s size. The initial velocity is maintained at 7.3 km/s, while the particles in the foils were stationary. A clamped boundary condition is applied to restrict the movement of the disintegrated foil fragments at the edges. The whole configuration is modelled using SPH particles, which are 3,61,564 in number, on average for each simulation.
Numerical Results and Discussion
This section will provide quantitative and qualitative measurements taken during the numerical studies carried out. The crater sizes for the first foil and the second foil are listed in Table 5. It is evident that no crater was found on the second foil when the MP is made of Aluminum while for the float glass case, the MP managed to penetrate through. The diameter of the crater on the first foil is the largest for the first case where densities of the foil material and the MP are similar. For the second case, the crater diameter is smaller than the MP diameter; it may be due to the brittleness of the float-glass MP.
| Post impact observation | Aluminum | Float-glass | Steel |
|---|---|---|---|
| First foil crater’s diameter d1 (µm) | 56.71 | 43.657 | 50.40 |
| Second foil crater’s diameter d2 (µm) | No | 2.7365 | 64.07 |
| Second foil’s diameter covered by the fragments, mm | 1.46 | 1.4 | 0.80 |
| Crater Diameter on Witness Plate (0.5 mm Thick) | - | - | 76.123 |
| Crater Diameter on Witness Plate (1.0 mm Thick) | - | - | 56.264 |
Table 5. Post impact observations.
Figure. 2 describes kinetic and geometrical parameters for the DC in the simulations. The α and β are calculated through averaging the velocity components. The front diameter of the debris cloud (D1) mostly consists of MP fragments while the overall diameter of the debris cloud (D2) contains whole fragments of foils and MPs. H is the distance before the DC is interacting with the second foil.

Figure 2: Geometrical description of debris cloud.
The debris cloud (DC) has been characterized through observing kinetic and geometric parameters and findings are presented in Table 6 . These observations were made when the DC is fully developed and about to interact with the second foil or the rear wall. It is found that there is not much difference between the DC kinetic and geometric parameters for aluminum MP and float glass MP, but the third case (steel MP) shows significant differences in the parameters, especially the DC velocities.
| Cases | a ° | ß ° | D1 mm |
D2 mm |
H mm |
V1 km/s |
V2 km/s |
V3 km/s |
|---|---|---|---|---|---|---|---|---|
| Case 1 | -56.26 | 51.92 | 1.5388 | 1.7503 | 4.9602 | 6.8531 | 5.422 | 4.012 |
| Case 2 | -57.20 | 50.90 | 1.2817 | 1.8321 | 4.9352 | 6.5976 | 5.8910 | 5.1728 |
| Case 3 | -54.90 | 54.63 | 1.14 | 1.366 | 4.927 | 8.65 | 7.15 | 6.012 |
Table 6. Geometrical and kinematic parameters of debris cloud.
The flight angle and the ejecta angle of the fragments are almost same in all three cases. In the third case study, the axial velocity of fragments (especially at the front of the DC) is found to be higher than the impact velocity of MP. It was likely due to the momentum imparted by the heavier MP to the lighter fragments of the front foil traveling in the same direction.
Figure. 3. illustrates the elements of the DC developed when the MPs interact with the bumper foil.

Figure 3: Debris cloud shapes of all three cases.
The bumper foil is ultra-thin and composed of multiple layers of particles. Upon interaction, a compression wave is produced in the foil, and this compression brings particles closer and raises the pressure on the surface of the foil and in the MP as well. The wave propagates through the material and changes the velocity of the particles, which influences strain and stress states of the material. In the first case, MP (aluminum) has the same density as the first bumper foil where some hollow shape may be seen inside the DC.
In the second case, where the MP (float-glass) has a lower density than the aluminum foil used, it shatters evenly but mainly carries float glass fragments. In the third case, the MP (steel) having three times higher density than the first foil, the foil breaks after the HVI, but does not shatter into smaller fragment clouds like the previous cases. The DC shape in all three cases is ellipsoidal, which mainly consists of fragments from the first bumper foil and is independent of its thickness. The only evident change is the shape of the front fragment cloud which might be possible due to the duration of the interaction. The hollow spherical shape is evident in the first case, which illustrates even distribution of the fragments and the energy dispersion, while in the second case the fragments are accumulated at the center. In the third case, the first foil is incapable of fragmenting the impacting MP. The MP and second foil conditions are presented in Figure. 4. and Figure. 5. respectively.

Figure 4: Conditions of MPs post-HVI (a) Al2024T3, (b) Float Glass and (c) Steel 4340.

Figure 5: Second foil’s condition after HVI (a) Al2024T3, (b) Float Glass, (c) Steel 4340.
The observation reveals that the float glass particles are completely damaged but still manage to penetrate the second foil where aluminum MP is unable to penetrate the second foil even though it still has an undamaged part. This can be attributed to release of the shock wave. Some energy remains in the material as thermal energy, and this thermal energy is manifested by the abrupt increment in the temperature during the interactions. This residual temperature is 1800 K and increases as the shock intensity increases; the shock intensity increases with the impacting velocity. During the impact, the temperature for aluminum reached 2615 K whereas for float glass, it is 2127 K. The melting temperature of aluminum is lower than float glass, and because to this, aluminum MP fragments vaporize and melt at an early stage forming a front layer in the DC. These liquid droplets may cause penetration acting as the loads, but owing to their light mass and even distribution of the fragments, they did not penetrate the second foil. For the float glass, most of the fragments stayed in the center and did not distribute evenly. This led to rise in the axial velocity of the fragments forming a crater on the second standoff foil. For the steel MP, the temperature rose to 1000 K, because it had a very small contact time with the foil and the steel has very high melting point. In the third case, the steel MP remained almost intact after passing through the first foil and its travel velocity increased due to the momentum conservation. The mass of DC varied in all three cases, which did not have much effect on the DC velocity, but it caused changes in the shape and geometry of DC.
The presented research undertook the numerical modelling of the hypervelocity impact of the microparticle (MP) on to the thin foils shield configurations. The numerical investigations have been carried for three types of the MP namely: aluminum, float glass, and steel 4340. The influence of these MP’s impact has been analyzed and key observations and a method to characterize the debris cloud is proposed. The interaction of MP to the first foil (Aluminum) exerts forces which further leads to shock wave (compression in nature) travels from the front to the rear surface. These shock waves upon reflection from boundaries travel as tensile shock wave which causes the spallation at the rear surface of the foil. These shock waves cause a discontinuity in pressure and temperature distributions on the foil, which leads a phase transition from solid to liquid, and liquid to vapor. In the first case study, the DC appears to be evenly distributed due to the similar density values of the first foil and MP materials. The placement of the second foil (standoff) at 5 mm allows the DC to expand enough to dissipate the energy before it interacts with the second foil. The numerical investigation indicates that the proposed shield configuration can suppress the damage due to the fact that the MP (aluminum) and its fragments are restricted at the second foil. For the second case (float-glass) study, the DC causes damage at the center of the second foil and creates a crater hole.
This crater hole allows fragments of DC to pass through. To mitigate this damage, the standoff distance is increased in the subsequent simulation. The increased standoff distance allows the fragments to spread and the results depict less damage on the second foil. Also, the DC was restricted. In the third case study (steel), due to its high density and stiffness, the MP did not shatter much after interacting with the first foil. The damage on the first and the second foils was severe. To suppress the damage, one extra plate (0.5 mm-1.00 mm thick) is placed at 5.0 mm from the second foil. Further investigation revealed that a 1-mm thick plate of Ti-6Al-4V could stop any fragments of this type of MP. It is observed that the relative properties of the MP and the foil materials make a difference in absorbing HVI. Harder and heavier MP such as steel, not only penetrate through the foils of lighter materials but also impart additional energy to the foil fragments increasing their travel velocity.
Conclusion
The present study provides a qualitative assessment of phenomenon simulation of the hypervelocity impact of MP on multiple foils shield configurations using AUTODYN®. The study indicated that the multiple foils shield configuration could restrain damage caused by the MPs made of aluminum and float glass. The first foil, when made of aluminum, is vulnerable to fragmentation by the impacting MP. This also found to distribute the imparted momentum resulting into finer fragments, which later got absorbed or restrained by the standoff foil made of Ti-6Al-4V. This numerical analysis aided in the visualization of various mechanisms under a hypervelocity impact event. It was noted that by increasing the standoff distance increases the time required for the debris cloud to travel and allows it to expand, resulting in the reduction in devastating energy. For the float glass MP, a standoff distance of 10 mm between the foils mitigated the HVI damage.
However, the proposed two foils shield configuration is not able to restrain the damage caused by the MP made of steel 4340. Further simulation revealed that there needs another witness plate of 1 mm thickness to restrain the damage completely.
Acknowledgment
The authors would like to express gratitude to Dr. Martin Rott, Technical University of Munich, Germany, for sharing his data in personal communication. The usage of the computational facility and other support at Nanyang Technological University, Singapore, is gratefully acknowledged.
List of Symbols and Abbreviations
| Symbols | Definitions | Symbols | Definitions |
|---|---|---|---|
| A | Initial Yield Stress | LEO | Low Earth Orbit |
| B | Strain Hardening Constant | m | Thermal Softening Parameter |
| C | Strain Rate Sensitivity Constant | MM | Micrometeoroids |
| C0 | Intercept of Shock and Particle Velocity | MP | Micro-particles |
| D | Damage Index | n | Strain Rate Exponent |
| D1 | Diameter of Front Debris Cloud |  |
Von Mises Flow Stress Or Equivalent Flow Stress |
| D2 | Diameter Debris Cloud |  |
Deviatoric Stress |
| DC | Debris Cloud |  |
Hydrostatic Stress |
| EOS | Equation of State |  |
Stress Triaxiality Ratio |
| E | Internal Energy Due to Shock Wave |  |
Pressure, Density |
 |
Dimensionless Plastic Strain Rate | S1,S2,S3 | Coefficients of Slope of us and up, |
 |
Strain-Rate | SD | Space Debris |
 |
User-Defined Reference Strain Rate | SPH | Smooth Particle Hydrodynamic |
 |
Failure Strain |  |
Melting, Room And Homologous Temperature, Respectively |
 |
Equivalent Plastic Strain Rate |  |
Compression Factor |
 |
Increment in Accumulated Plastic Strain | V1 | Front Debris Velocity |
 |
Accumulated Plastic Strain to Failure | V2 | Mid Debris Velocity |
| GEO | Geosynchronous Earth Orbit | V3 | Rear Debris Velocity |
| HVI | Hypervelocity Impact | α | Flight Angle |
| HEL | Hugoniot Elastic Limit | β | Ejecta Angle |
| JC | Johnson-Cook |  |
Mie-Gruneisen Coefficient |
| JH | Johnson-Holmquist | KE | Kinetic Energy |
References
- Maclay TD, Culp RD, Bareiss L, et al. Topographically modified bumper concepts for spacecraft shielding. Int J Impact Eng. 1993;14(1):479-89.
- Active space-debris removed an inevitability. The Royal Canadian Air Force; 2014.
- Taylor MW. Orbital debris: Legal and technical issues and solutions; 2006.
- http://orbitaldebris.jsc.nasa.gov/protect/shielding.html.
- Ang JA, Chhabildas LC, Reinhart WD, et al. Hypervelocity testing of advanced shielding concepts for spacecraft against impacts to 10 km/s. Int J Impact Eng. 1993. 14(1-4): 95-106.
- Christiansen EL, Crews JL, Williamsen JE, et al. Enhanced meteoroid and orbital debris shielding. Int J Impact Eng. 1995;17:217-28.
- Christiansen EL, Kerr JH. Mesh double-bumper shield: A low-weight alternative for spacecraft meteoroid and orbital debris protection. Int J Impact Eng. 1993;14(1): 169-80.
- Christiansen EL, Kerr JH, De la Fuente HM, et al. Flexible and deployable meteoroid/debris shielding for spacecraft. Int J Impact Eng. 1999;23:125-136.
- Christiansen EL, Nagy K, Lear DM, et al. Space station MMOD shielding. Acta Astronautica. 2009;65:921-29.
- Christiansen EL, Robinson JH, Crews JL, et al. Space station freedom debris protection techniques. Adv Space Res. 1993;13(8):191-200.
- Cour-Palais BG, Crews JL, Lee J. A multi-shock concept for spacecraft shielding. Int J Impact Eng. 1990;10(1):135-46.
- Destefanis R, Schäfer F, Lambert M, et al. Selecting enhanced space debris shields for manned spacecraft. Int J Impact Eng. 2006;33:219-30.
- Swift HF, Bamford R, Chen R. Designing space vehicle shields for meteoroid protection: A new analysis. Adv Space Res. 1982;2(12):219-34.
- Tanaka M, Moritaka Y. Single bumper shields based on Vectran fibers. Adv Space Res. 2004;34(5):1076-79.
- Tanaka M, Moritaka Y, Akahoshi Y, et al. Development of a lightweight space debris shield using high strength fibers. Int J Impact Eng. 2001;26:761-72.
- Das R, Mikhail J, Cleary PW. Modelling hypervelocity impact fracture of ceramic panels using a mesh-free method. Mater Sci Eng. 2010;10(1):012058.
- Nicholas T, Recht RF. Introduction to impact phenomena in high velocity impact dynamics. In: Zukas JA, editor. John Wiley and Sons, New York; 1990.
- Guida M, Marulo F, Meo M, et al. Analysis of bird impact on a composite tailplane leading edge. Appl Compos. Mater. 2008;15:241-57.
- Lacome JL, Espinosa Ch, Gallet C. Simulation of hypervelocity space crafts and orbital debris collisions using smoothed particle hydrodynamics in LS-DYNA; 2014.
- Toole BO, Trabia M, Hixson R, et al. Modeling plastic deformation of steel plates in hypervelocity impact experiments. Procedia Eng. 2015;103:458-65.
- Rott M. Typical Impact. Technical University of Muni; 2014.
- Johnson GR, Cook WH. A constitutive modeling and data for metals subjected to large strains, high strain rates and high temperature. In: Proceeding 7th International Symposium on Ballistics, Hageue, Netherlands; 1983.
- Kay G. Failure modeling of titanium-6Al-4V and 2024-T3 aluminum with the Johnson-Cook material model; 2002.
- Peters M, Leyens C. Aerospace and Space Materials. Materials Science and Engineering; 2009.
- http://148.204.81.206/Ansys/150/ANSYS%20Fluent%20Users%20Guide.pdf
- Zukas JA. Survey of computer codes for impact solution, in high velocity impact dynamics. Zukas JA, editor. John Wiley and Sons: New York; 1990.
- http://dsk.ippt.pan.pl/docs/abaqus/v6.13/index.html.
- Leseur DR. Experimental investigations of material models for Ti-6A1-4V and 2024-T3; 1999.
- Lesuer DR, Kay GJ, LeBlanc MM. Modeling large-strain, high-rate deformation in metals; 2001.
- Steinberg D. Equation of state and strength properties of selected materials. Lawrence Livermore National Laboratory; 1996.