Original Article
, Volume: 15( 3)A Facile Synthesis of TiO2 Nanotube Co-Loaded with Pt Nanoparticles and Reduced Graphene Oxide with Enhanced Photocatalytic Activity under UV/Visible Light
- *Correspondence:
- Thu Ha Thi Vu National Key Laboratory for Petrochemical and Refinery Technologies, Hanoi, Vietnam
Tel: +84-422189067; E-mail: ptntd2004@yahoo.fr
Received Date: June 06, 2017 Accepted Date: July 17, 2017 Published Date: July 24, 2017
Citation: Vu THT, Do MH, Au HT, et al. A Facile Synthesis of TiO2 Nanotube Co-Loaded with Pt Nanoparticles and Reduced Graphene Oxide with Enhanced Photocatalytic Activity under UV/Visible Light. Int J Chem Sci 2017;15(3):159
Abstract
A facile and one-step method was used to prepare Pt-graphene/TiO2 nanotube (Pt/RGO-TiO2NTs) photocatalyst via a chemical reduction process. The as-prepared samples were characterized by X-ray diffraction, transmission electron microscopy, Raman spectroscopy, ultraviolet visible diffuse reflectance spectroscopy and photoluminescence emission spectroscopy. The photocatalytic activities were investigated by the degradation of Methyl Blue (MB) under simulated solar light irradiation. The highly efficient photocatalytic activity was associated with broad absorption in the visible light region, increased photo induced charge separation through transferring photogenerated electrons from TiO2NTs to both Pt and RGO, as well as the strong adsorption ability of RGO to MB molecules. The Pt, RGO and Pt-RGO composite doped TNTs array synthesized by anodization route demonstrated the same tendency of efficiencies of photo electrochemical properties that could be benefit for developing a photo water splitter. Moreover, the Pt-RGO/TNTs had an excellent stability.
Keywords
Nanoparticles; Spectroscopy; Photocatalysyts; Pollutants
Introduction
TiO2 nanotubes (TNTs) have been receiving extensive interest due to that they have nanostructure, large specific surface area, good electron/proton conductivity, high aspect ratio, and ion exchange [1,2] and applied for many fields, including photocatalysis [3], lithium batteries [4,5], gas sensors [6], dye-sensitized solar cells [7], and waste water purification [8].
However, the main drawbacks of pure TNTs photocatalyst, narrow light-response range and rapid recombination of photoinduced electron/hole pairs which result in low efficiency in the utilization of solar energy. To overcome the drawbacks, numerous strategies have been adopted to improve the photocatalytic performance of TNTs, including noble metal loading (Pt, Ag) [9,10], non-metal element doping (C, N) [11,12], and coupling with semi-conductors (CdS, CuO, Cd0.5Zn0.5S) [2,13-15].
Recently, the significant improvements in TNTs photocatalytic performance has been demonstrated by incorporating novel carbonaceous nanomaterials, such as carbon nanotubes (CNTs) [16,17] and fullerenes [18], to form carbon-TiO2 nanocomposite photocatalysts. In particular, GR, as a newly discovered two-dimensional (2-D) carbonaceous material, possesses outstanding mechanical, thermal, optical, and electrical properties, and many researchers have been demonstrated that the combination of graphene and TiO2 shows an enhancement of photocatalytic activity for use in photocatalytic water splitting [19-27] as well as photodegradation of pollutants [22,28-32]. Dang et al. [33] demonstrated that a TNTs/GR photocatalyst was prepared by alkaline-hydrothermal method that had a larger photocatalytic H2 evolution, two times higher than that of pure TNTs. Enhanced electroto-catalytic activity of Pt nanoparticles dispersed on the GR/TiO2 had already reported [34]. Chen et al. [35] reported the applicationin photo-degradation of methyl orange (MO) overAu/RGO-TiO2 nanotube arrays, which showed a highly efficient photocatalytic activity associated with broad absorption in the visible light region. Sim et al. [36] demonstrated that the successful depositions of Pt and RGO onto the surface of TNTs contributed to the significant improved photocatalytic activity in the reduction of CO2 compared with TNTs and Pt-TNTs.
Herein, we developed a simple one-step chemical reduction process to prepare Pt NPs and RGO co-modified TiO2 NTs. In which, graphene oxide is mixed with Pt and resulting solution by microwave followed by mixing of TiO2 NTs. In this process, chemical reduction of graphene oxide into graphene and attachment of noble metal nanoparticles and TNTs are observed in ethylene glycol solution. The photocatalytic activity of Pt/RGO-TiO2 NTs hybrid material was tested by MB as a model contaminant under simulated solar light irradiation was investigated. This result gives a potential development towards graphene based efficient photo catalyst that employed UV/Visible light as an energy source.
Experimental
Preparation of graphene
Graphite expanded powder was used to synthesize graphite oxide through modified Hummers method [37]. 10 g of graphite expanded powder was mixed with conc. H2SO4 (230 ml) at 0°C with vigorous magnetic stirring. In the next step 30 g of KMnO4 was slowly added to the flask and the temperature was kept below 20°C. The resulting mixture was stirred at 35°C for 30 min with stirring, and it was then added to 450 ml using de-ionized (DI) water. After adding water into the container was sealed and keeps at 98°C with vigorous stirring for 40 min followed by the addition of 140 ml DI and 30 ml 30% H2O2. The mixture was then washed several times with 5% HCl solution to eliminate residual metal ions. The solutions were filtered and then the obtained GO was diluted to DI water under ultrasonicated for 30 min to form GO suspension.
Preparation of RGO/TNTs
25 ml GO suspension (2 mg/ml) and TNTs were dispersed in ethylene glycol (EG) solution (30 ml) under ultrasonicated for 10 min at weight ratios of RGO to TNTs of 10%. The obtained suspension was transferred into reaction flask and refluxed at 110°C for 24 h. The resulting products were filtered and washed several times with distilled water and then dried at 50°C under vacuum for 12 h to achieve RGO/TNTs.
Preparation of TNTs and TNTs arrays
TNTs were prepared via an alkaline hydrothermal. The details of its preparation were reported in our previous study [38]. Otherwise, Titania nanotubes arrays (TNTs arrays) were prepared by electrochemical anodization in glycerol, NH4F- containing electrolyte. Prior to experiment, Ti foil with dimension 20 × 20 × 0.3 (mm) was polished by hand with various abrasive papers and then degreased and washed with DI water. The surface of Ti was reactivated for anodization process by dipping the Ti foil in a mixture of diluted solution of NH4F and HNO3 within 5 seconds, followed by washing with DO water. The electrochemical anodization was carried out in a two-electrode cell using a DC power source, where the Ti foil was used as the anode and a thin stainless-steel foil as the cathode. The anodization was performed at bias voltage of 25 V during 8 h at room temperature (298 K) in an electrolyte containing NH+F (0.32%), sodium acetate (0.07 M) and water (15%) dissolved in glycerol. The pH of electrolyte was controlled at 5 by adding the diluted H2SO4 solution. After the period of anodization, the Ti foil was immediately washed with a large amount of DI water, then drying at 120°C for 12 h and finally annealing at 500°C for 4 h in air.
Preparation of Pt/TNTs and Pt/TNTs arrays
In the typical synthesis of Pt-RGO/TNTs, 25 ml GO suspension (2 mg/ml) and 10.25 ml H2PtCl6 (10 mmol) and 0.2 g TNTs were dispersed in ethylene glycol (EG) solution (30 ml) under ultrasonicated for 10 min. The obtained suspension was transferred into reaction flask and refluxed at 11°C for 24 h. The resulting products were filtered and washed several times with distilled water and then dried at 50°C under vacuum for 12 h. The weight ratios of GO to TNTs were taken as 5%, 10%, and 20% the obtained samples were labeled as PGT-05, PGT-10, and PGT-20 respectively.
The synthesis of Pt-RGO/TNTs arrays was performed using the same procedure for producing the Pt/TNTs arrays as described in paragraph 2.4. In this case, the mixture containing 25 ml GO suspension (2 mg/ml) and 10.25 ml H2PtCl6 (10 mmol) and 30 ml ethylene glycol (EG) was ultrasonicated for attaining a uniform suspension before being used for 5-time sequential impregnation-reduction process on the surface of TNTs arrays. A sample of RGC/TNTs array was also synthesized for reference by adopting the procedure above described but using 10.25 ml of H2O instead of H2PtCl6 solution.
Characterization
The morphologies of the TNTs based samples were investigated by transmission electronic microscopy (TEM) using a Leica LEO 906 E instrument operating at 120 kV. A field emission scanning electron microscope (FESEM) with model JSM 7600F (JEOL) was used to characterize the morphology of the TNTs arrays based materials (TNTs array, Pt/TNTs array and Pt- RGC/TNTs array). The surface composition of the synthezied samples were analyzed by the Energy Dispersive X-Ray (Model X-Max-50 Oxford Instruments). X-ray diffraction (XRD) was determined over the 2θ range 10°-80° (D8 ADVANCE, Bruker, Germany) using copper radiation CuKαl(λ=0.16A°) as the X-ray source. UV-vis diffuse reflectance spectra (DRS) were obtained on a Cary 300 Conc UV-visible spectrophotometer. Photoluminescence (PL) spectra were measured at room temperature on a fluorescence spectrophotometer (iHR550, Jobin-Yvon, French) at an excitation wavelength of 355 nm. Raman spectroscopy was performed in a wave number range of 80 cm-1 -2500 cm-1 using a LabRam HR with the excitation wavelength at 532 nm. The surface properties of prepared samples were characterized by X-ray photoelectron spectroscopy (XPS) by using a Perkin-Elmer PHI 1600 ESCA system with a monochromatic Mg Kα source and a charge neutralizer.
Experiment of photocatalytic test
Photocatalytic activity of Pt–RGO/TNTs was tested by using Methyl Blue as an organic dye. In each test 0.2 g of catalytic sample was taken in 100 ml solution of MB (10 mg l-1). The solution was stirred on a magnetic stirrer at room temperature for several minutes moderately and kept in the dark for 2 h to assure absorption/desorption equilibrium of the dye on the catalyst. After two hours, the solution was exposed to solar lamp (OSRAM 250 W) as light source which was kept at 20 cm above the solution. Samples were collected after 120 min and centrifuged at 3500 rpm for 10 min instantly to remove the solid material from the solution for further analysis. The MB concentration was obtained from linear calibration line representing the absorbance of the 663-nm absorption band versus MB concentration by mean of an UV-vis spectrophotometer.
The photo-electrochemical (PEC) experiments was conducted in a two-electrode configuration under illumination of solar lamp (OSRAM 250 W) with the prepared samples as working electrode and stainless steel as counter electrode. The electrolyte was NaOH 0.1 M solution. The PEC test was investigated by applying a bias of open-circuit voltage (0-1V) from a DC power supply. The photocurrent was measured by Digital multimeter (FLUKE 15B) connected in line between the external source and the TNTs array anode under illumination of 40000 lux equal to 6 mWcm-2. The values of light current were taken when the system became stable. The dark current was measured in the same condition without illumination for reference. These experiments were performed not only for evaluating photo-electrochemical properties of TNTs arrays based material but also for studying their capacity of water photo-electrolyzing to produce hydrogen.
Results and Discussion
Characterization
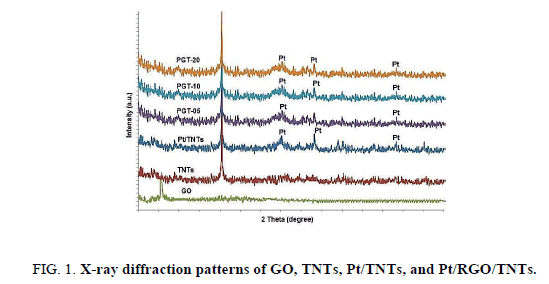
The diffraction patterns of the studied samples are shown in Figure. 1. The sharp diffraction peak at 25.3° corresponds to (1 0 1) crystal plane of anatase TiO2 (JCPDS no. 21-1272) is well observed for all TNTs based photocatalysts [39]. Specific peaks of Pt are observed for Pt-TNTs and Pt-RGO/TNTs at 40°, 46.2° and 67.4°. A diffraction peak recorded at 10. 10 are attributed to GO. After the reduction of GO, the peak of RGO at around 25° is not shown in the PGT-10 samples, which may be due to the disappearance of the layer-stacking regularity of RGO after intercalation by TNTs. Compared with the XRD spectra of unmodified TNTs, there is no obvious difference of TNTs phase in different samples indicates that the crystalline structure of TiO2 NTs was not influenced by the reduction of RGO and Pt NPs.
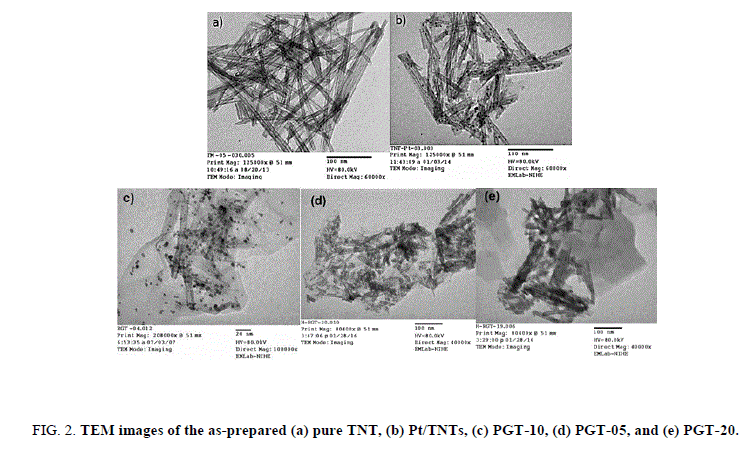
Figure. 2 shows the characterized results of the microscopic structures and morphology of the pure TNT, Pt-TNTs, RGO/TNTs, and Pt-RGO/TiO2 NTs nanocomposites. As shown in Figure. 2a, a 1-D tubular morphology with diameters of ca. 10 nm and lengths of ca. 100 nm-150 nm can be clearly observed. Figure. 2b shows the TEM image of Pt-TNTs and Figure. 2c shows the TEM image of Pt-TNTs anchored onto the GR sheets with the surface of TNTs uniformly with Pt NPs. It is also diagnosed that the morphology of the TNTs remains unchanged after the encapsulation of the impurities. As showed in Figure. 2d, there was no appreciable present of GR sheet in PGT-05. A higher weight ratio of GO (20%) to TNTs in PGT-20, GO was not well dispersed and Figure. 2e shows that the RGO sheet was made the clusters and not uniformly covered TNTs and Pt NPs. The presence of the specific elements in the composite like Pt, C, O and Ti is confirmed by obtained EDX spectrum.
Figure 2: TEM images of the as-prepared (a) pure TNT, (b) Pt/TNTs, (c) PGT-10, (d) PGT-05, and (e) PGT-20.
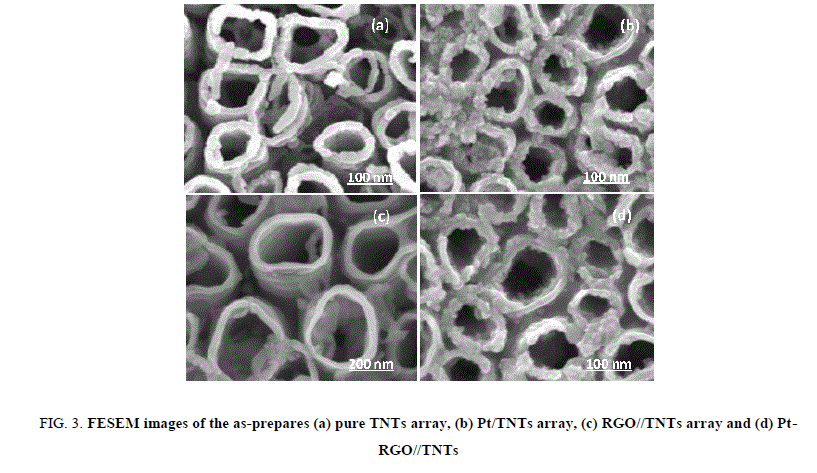
The microscopic structures and morphologies of pure TNTs array, Pt/TNTs array, RGC/TNTs arrays and Pt-RGC/TNTs array were characterized by FESEM images that are collected in the Figure. 3. The FESEM images show that the diameters of TNT obtained by anodization process were located within the range of 80 nm-120 nm as presented in the Figure. 3a of pure TNTs array. Figure. 3b demonstrates that the Pt nanoparticles with the size of 5 nm-10 nm have been formed, well dispersed and anchored on the surface of TNTs arrays. Likewise, Figure. 3c validates the good dispersion of RGC film on the TNTs array both inside and outside of nanotubes of titania. Last but not least, the FESEM image of Pt-RGC/TNTs arrays as showed in Figure. 3c evident that the RGC film and Pt nanoparticles have been homogenously deposited on the surface of TNTs array. Likewise, Figure. 3c validates the good dispersion of RGC film on the TNTs array both inside and outside of nanotubes of titania. Last but not least, the FESEM image of Pt-RGC/TNTs arrays as showed in Figure. 3c evident that the RGC film and Pt nanoparticles have been homogenously deposited on the surface of TNTs array.
Figure 3: FESEM images of the as-prepares (a) pure TNTs array, (b) Pt/TNTs array, (c) RGO//TNTs array and (d) Pt- RGO//TNTs
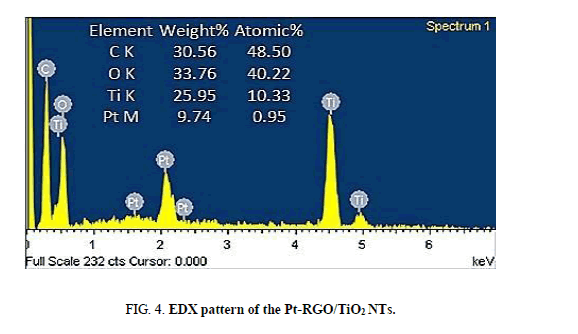
The elemental analysis of the composite was carried out by acquiring EDX spectra as shown in Figure. 4. The EDX result shows that the Pt/RGO co-modified TNTs and TNTs arrays contain the elements of C, O, Pt, and Ti. The contents ratio of C and Pt are about 48.5/0.95 (atom/atom).
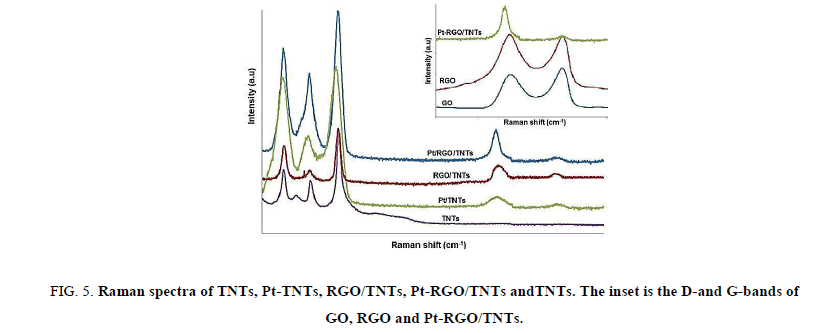
Raman spectroscopic measurement was used to characterize the ordered and disordered crystal structures of carbon based materials. As shown in Figure. 5, D band and G band were all observed in the Raman spectra of GO, RGO, and Pt-RGO/TNTs. The Raman spectrum of GO shows two characteristic peaks, namely, the D band at 1355 cm-1 and the G band at 1600 cm-1. The D band is assigned to edge or in-plane sp3 defects and disordered carbon, whereas the G band arises from the in-plane vibration of ordered sp2-bonded carbon atoms. The ID/IG peak intensity ratio is calculated to characterize the level of defect in RGO. When GO is reduced to RGO, an increment in the intensity ratio of the D and G bands (ID/IG) was observed for the GO, RGO and Pt-RGO/TNTs, suggesting that increased defects were brought by the reduction of graphene oxide, indicating the partial restoration of sp2-hybridized network due to the removal of oxygenated functional groups that increase the defect level and also confirms the partial reduction of GO into RGO during the chemical reduction process.
Figure 5: Raman spectra of TNTs, Pt-TNTs, RGO/TNTs, Pt-RGO/TNTs andTNTs. The inset is the D-and G-bands of GO, RGO and Pt-RGO/TNTs.
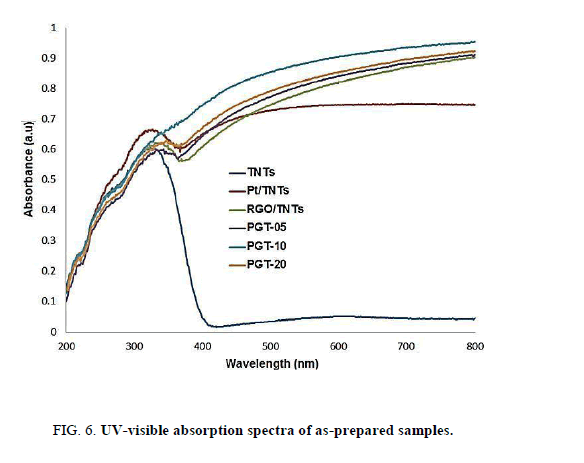
The UV-visible diffuse reflectance spectra that endorse the visible light responsiveness characters of the photocatalysts are shown on Figure. 6. The pure TNTs exhibits a good absorption band moderately around 380 nm (UV region) owing to the charge transfer from O2 p valence band to Ti 3d conduction band corresponding to the band gap energy of 3.2 eV in the ultraviolet region. Compared with the unmodified TNTs, all the modified TNTs displayed enhanced absorption in the UV- visible region and significantly red-shifted absorption edges which are attributed to the form of Ti3+ ions and oxygen vacancies in metal or carbon-doped TiO2 materials [35]. The Pt NPs-doped TNTs is clearly observed at around 450 nm. This notable behavior leads to the absorption edge of Pt-TNTs shifts toward the visible spectrum. In the nanocomposites, a gradual redshift to longer wavelengths is observed for the Pt-RGO/TNTs with increasing RGO mass ratio. In the Pt- RGO/TNTs, the dark appearance of carbon species from RGO contributes for the reduction of light reflection and thus, boons the absorption of visible spectrum [36].
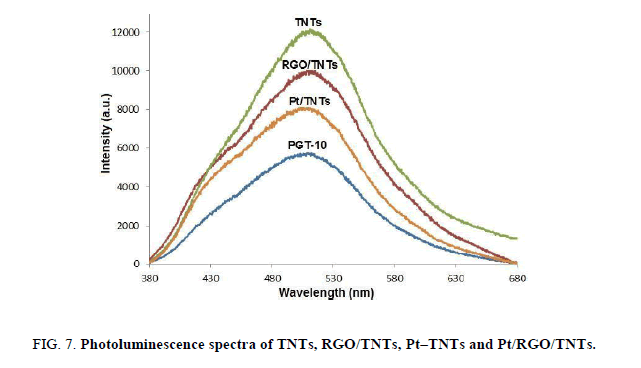
To investigate the efficient separation of charge carriers in the nanocomposites, photoluminescence (PL) spectroscopy was carried out to reveal the migration, transfer, and recombination processes of photoinduced electron/hole pairs. Figure. 7 shows the PL emission spectra of as-prepared at an excitation wavelength of 355 nm. The lowest recombination of the electron-hole pair is achieved by PGT-10 where it shows the lowest emission intensity among all. As shown in Figure. 7, the PL intensity decreased successively in the order of unmodified TNTs, Pt/TNTs, RGO/TNTs and PGT-10, implying that the photoinduced electrons transferred from TNTs to Pt or RGO, and the Pt and RGO as co-modifiers showed an enhanced ability in capturing photoinduced electrons compared to either Pt or RGO alone. Among the photocatalysts, PGT-10 was presented as the highest absorption in the UV-visible region. This significant boost in photocurrent demonstrates the higher efficiency of the charge separation occurred in the ternary composite. Naturally, it will reflect a beneficial result in the photocatalytic performance.
Photocatalytic properties of Pt-RGO/TNTs
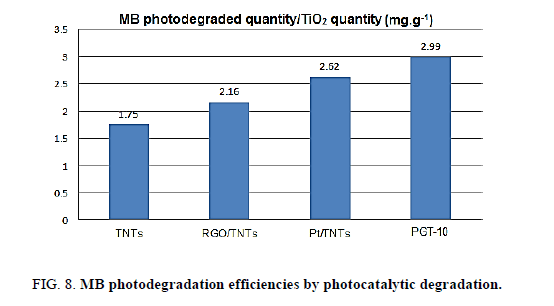
Methyl blue was selected as a modal pollutant to evaluate the photocatalytic effect of Pt/RGO/TNTs under the simulated solar light. The TNTs was used as reference sample. As shown in Figure. 8, under the same conditions, the removal efficiency of MB by using unmodified TNTs was 1.75 mg MB/g TiO2, indicating the limited photocatalytic activity of TNTs due to its poor visible-light response and low absorptivity. The removal efficiency of Pt/TNTs and RGO/TNTs were up to 2.16 and 2.62, respectively. A higher degradation efiiciency of Pt/TNTs than RGO/TNTs is mainly attributed to the higher photoinduced charge separation in Pt/TNTs that is evidenced by the lower recombination of the electron-hole pair in Pt/TNTs than in RGO/TNTs (Figure. 7). Among the photocatalysts, PGT-10 was presented as the best efficiency of 2.99 mg MB.g10-9 TiO2, almost 1.7 times that over unmodified TNTs.
The Pt and RGO as co-modifiers achieved a remarkable enhancement in total yield of MB compared to that of TNTs, Pt/TNTs and RGO/TNTs. The presence of Pt NPs in Pt-TNTs equalized the Fermi level (Ef) of TNTs to the working function of Pt NPs and thus the CB of TNTs became lower, facilitating electrons transfer from Pt NPs to CB of TNTs. In the junction between Pt NPs and TNTs, the occurrence of electron collision further excited the electron movement from VB to CB of TNTs, leaving holes at VB. The electron-hole pairs recombination time (10-9 s), is known to be fast. Hence this deficiency was overcome by depositing RGO sheets onto the surface of Pt/TNTs to prolong the lifetime of electron-hole pairs. The RGO is well known for its two-dimensional and planar π-conjugation structure which endows it with excellent electron conductivity and RGO sheets provided a rapid pathway to trap the electrons from TNTs, leading to enhance the separation of charge carriers [36].
Photo-electrochemical properties of Pt-RGO/TNTs arrays
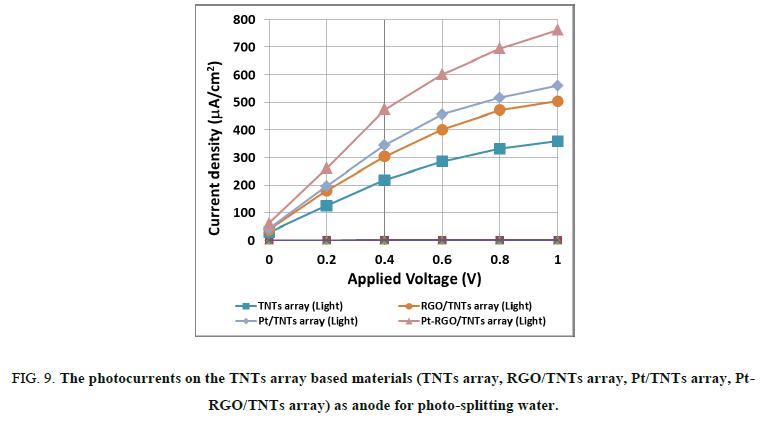
The Figure. 9 shows the current densities on TNTs array, Pt/TNTs array, RGO/TNT array and Pt-RGO/TNT array electrodes measured in NaOH 0.1M electrolytes under and dark condition. In the dark (without illumination) the values of current density measured on these four electrodes were nearly the same range of 0.5-1 µA/cm2. When the electrochemical system was illuminated, the photocurrent densities increased significantly and the illumination effect was different form this sample to the others. With increasing the applied voltage from 0 to 1 Volt, the photocurrents elevated continuously then tended to nearly stable states at about 1 Volt. Meaningful that the minimum voltage needed to electrolyze water is 1.23 Volt, the applied voltage (1 Volt maximum) was used just for diminishing the activation energy of reaction, therefore boosting the photocurrents and also the water splitting rates. Rationally, the photocurrents increased with the series of TNTs array, RGO/TNTs array, Pt/TNTs and Pt-RGO/TNTs array. This photoactivity tendency of Pt, RGO and Pt-RGO doping has been also observed on the samples of TNTs based materials when the latters were tested for determining the efficiencies of MB removal. The best performance of photo-electrochemical property was awarded to Pt-RGO/TNTs array that could be attributed to the beneficial synergy of the Pt-RGO composite by perfecting the band structure as well as the photoelectron hole separation and transfer phenomena that were similarly found on the CdS doped TNTs array [40,41]. The photocurrents measured on the Pt-RGO/TNTs array was up to 762 μA/cm2, twice more important than photocurrents obtained on pure TNTs array electrode.
Figure 9: The photocurrents on the TNTs array based materials (TNTs array, RGO/TNTs array, Pt/TNTs array, Pt- RGO/TNTs array) as anode for photo-splitting water.
Conclusion
A Pt/RGO co-loaded TNTs hybrid material has been prepared by a simple chemical reduction method. The incorporated Pt NPs distributed on the surface of TNTs with some wrapped on tube wall. Phase and series of spectroscopic analysis robustly pronounced the well removal of redundant oxygen-containing functional groups in RGO. The superior electron-hole pair separation in the resulting sample was reflected from the quenching of PL spectra. Compared with Pt/TNTs, RGO/TNTs, and unmodified TNTs, the Pt/RGO/TNTs exhibited obviously enhanced photocatalytic activity in the photodegradation of MB under the simulated solar light illumination, which can be attributed to increased photoresponse both in the UV and in the visible region, high electron-hole separation efficiency, and improved absorptivity toward organic pollutant molecules, resulting from the synergetic effects of RGO and Pt NPs. This simple methodology will be easily used for the design of highly efficient and stable photocatalyst for environmental treatment applications. Furthermore, the Pt, RGO and Pt-RGO composite doped TNTs array synthesized by anodization route demonstrated the same tendency of efficiencies of photo electrochemical properties. This result is very useful for enhancing the photoactivity of TNTs array in water splitter applications.
Acknowledgement
The authors would like to thank the National Foundation for Science and Technology Development-NAFOSTED that funded the basic research oriented application project, code 11/2012/HD-DHUD and this article is part of the research results
References
- Bavykin DV, Friedrich JM, Walsh FC. Protonated titanates and TiO2 nanostructured materials: Synthesis, properties, and applications. Adv Mater. 2006;18:2807-24.
- Chen YB, Wang LZ, Lu GQ, et al. Nanoparticles enwrapped with nanotubes: A unique architecture of CdS/titanate nanotubes for efficient photocatalytic hydrogen production from water. J Mater Chem. 2011;21:5134-41.
- Yu HG, Yu JG, Cheng B, et al. Synthesis, characterization and photocatalytic activity of mesoporous titania nanorod/titanate nanotube composites. J Hazard Mater. 2007;147:581-7.
- Li JR, Tang ZL, Zhang ZT. H-titanate nanotube: A novel lithium intercalation host with large capacity and high ratecapability. Electrochem Commun. 2005;7:62-7.
- Park SJ, Kim YJ, Lee H. Synthesis of carbon-coated TiO2 nanotubes for high-power lithium-ion batteries. J Power Sources 2011;196:5133-7.
- Sennik E, Colak Z, Kilinc N, et al. Synthesis of highly-ordered TiO2 nanotubes for a hydrogen sensor. Int J Hyd Energy 2010;35:4420-7.
- Kim GS, Seo HK, Godble VP, et al. Electrodeposition of titanate nanotubes from commercial titania nanoparticles: application to dye-senstitized solarcells. Electrochem Commun. 2006;8:961-6.
- Xu SP, Ng JW, Du AJ, et al. Highly efficient TiO2 nanotube photocatalyst for simultaneous hydrogen production and copper removal from water. Int J Hyd Energy. 2011;36:6538-45.
- An HQ, Zhou J, Li JX, et al. Deposition of Pt on the stable nanotubular TiO2 and its photocatalytic performance. Catal Commun. 2009;11:175-9.
- Liu ZH, Chen JZ, Zhang YY, et al. The effect of sandwiched Ag in the wall of TiO2 nanotube on the photo-catalytic performance. Mater Chem Phys. 2011;128:1-5.
- Vijayan BK, Dimitrijevic NM, Finkelstein-Shapiro D, et al. Coupling titania nanotubes and carbon nanotubes to create photocatalytic nanocomposites. ACS Catal. 2012;2:223-9.
- Peng YP, Lo SL, Ou HH, et al. Microwave-assisted hydrothermal synthesis of N-doped titanate nanotubes for visible-light-responsive photocatalysis. J Hazard Mater. 2010;183:754-8.
- Li CL, Yuan J, Han BY, et al. TiO2 nanotubes incorporated with CdS for photocatalytic hydrogen production from splitting water under visible light irradiation. Int J Hydrogen Energy. 2010;35:7073-9.
- Xu SP, Du AJ, Liu JC, et al. Highly efficient CuO incorporated TiO2 nanotube photocatalyst for hydrogen production from water. Int J Hyd Energy. 2011;36:6560-8.
- Chen YB, Guo LJ. Highly efficient visible-light-driven photocatalytic hydrogen production from water using Cd0.5Zn0.5S/TNTs (titanate nanotubes) nanocomposites without noble metals. J Mater Chem. 2012;22:7507-14.
- Woan K, Pyrgiotakis G, Sigmund W. Photocatalytic carbon-nanotube-TiO2 composites. Adv Mater. 2009;21:2233-9.
- Yu JG, Ma TT, Liu SW. Enhanced photocatalytic activity of mesoporous TiO2 aggregates by embedding carbon nanotubes as electron-transfer channel. Phys Chem ChemPhys. 2011;13:3491-501.
- Yu JG, Ma TT, Liu G, et al. Enhanced photocatalytic activity of bimodal mesoporous titania powders by C60 modification. Dalton Trans. 2011;40:6635-44.
- Zhang XY, Li HP, Cui XL, et al. Graphene/TiO2 nanocomposites: Synthesis, haracterization and application in hydrogen evolution from water photocatalytic splitting. J Mater Chem. 2010;20:2801-6.
- FanWQ, Lai QH, Zhang QH, et al. Nanocomposites of TiO2 and reduced graphene oxide as efficient photocatalysts forhydrogen evolution. J Phys Chem C. 2011;115:10694-701.
- Shen JF, Yan B, Shi M, et al. One step hydrothermal synthesis of TiO2-reduced graphene oxidesheets. J Mater Chem. 2011;21:3415-21.
- Li N, Liu G, Zhen C, et al. Battery performance and photocatalytic activity of mesoporous anatase TiO2 nanospheres/graphene composites by template-free self-assembly. Adv Funct Mater. 2011;21:1717-22.
- Xiang QJ, Yu JG, Jaroniec M. Synergetic effect of MoS2 and graphene as cocatalysts for enhanced photocatalytic H2 production activity of TiO2 nanoparticles. J Am Chem Soc. 2012;134:6575-8.
- Lv XJ, Zhou SX, Zhang C, et al. Synergetic effect of Cu and graphene as cocatalyst on TiO2 for enhanced photocatalytic hydrogen evolution from solarwater splitting. J Mater Chem. 2012;22:18542-9.
- Zhang XY, Sun YJ, Cui XL, et al. A green and facile synthesis of TiO2/graphene nanocomposites and their photocatalytic activity for hydrogen evolution. Int J Hyd Energy. 2012;37:811-5.
- Cheng P, Yang Z, Wang H, et al. TiO2 egraphene nanocomposites for photocatalytic hydrogen production from splitting water. Int J Hydrogen Energy. 2012;37:2224-30.
- Wang ZY, Huang BB, Dai Y, et al. Crystal facets controlled synthesis of graphene TiO2 nanocomposites by a one-pot hydrothermal process. Cryst Eng Comm. 2012;14:1687-92.
- Zhang H, Lv XJ, Li YM, et al. P25 graphene composite as a high performance photocatalyst. ACS Nano. 2010;4:380-6.
- Zhou KF, Zhu YH, Yang XL, et al. Preparation of graphene TiO2 composites with enhanced photocatalytic activity. New J Chem. 2011;35:353-9.
- Jiang BJ, Tian CG, Pan QJ, et al. Enhanced photocatalytic activity and electron transfer mechanisms of graphene/TiO2 with exposed facets. J Phys Chem C. 2011;115:23718-25.
- Lee JS, You KH, Park CB. Highly photoactive, low bandgap TiO2 nanoparticles wrapped by graphene. Adv Mater. 2012;24:1084-8.
- Liu BT, Huang YJ, Wen Y, et al. Highlydispersive facets exposed nanocrystalline TiO2 on highquality graphene as a high performance photocatalyst. J Mater Chem. 2012;22:7484-91.
- Dang H, Dong X, Dong Y, et al. Facile and green synthesis of titanate nanotube/graphene nanocomposites for photocatalytic H2 generation from water. J Hydrogen Energy. 2013;38:9178-85.
- Ullah K, Zhu L, Meng ZD, et al. A facile and fast synthesis of novel composite Pt-graphene/TiO2 with enhanced photocatalytic activity under UV/Visible light. Chem Eng. 2013;pp:76-83.
- Chen Y, Tang Y, Luo S, et al. TiO2 nanotube arrays co-loaded with Au nanoparticles and reduced graphene oxide: Facile synthesis and promising photocatalytic application. J Alloys and Compounds. 2013; 578:242-8.
- Sim LC, Leong KH, Saravanana P, et al. Rapid thermal reduced graphene oxide/Pt-TiO2 nanotube arrays for enhanced visible-light-driven photocatalytic reduction of CO2. App Surface Sci. 2015; 358:122-9.
- Hummers W, Offeman R. Preparation of graphitic oxide. J Am Chem Soc. 1958;80:1339.
- Vu THT, Au HT, Tran LT, et al. Synthesis of titanium dioxide nanotubes via one-step dynamic hydrothermal process. J Mater Sci. 2014;49:5617-25.
- Yu J, Low J, Xiao W, et al. Enhanced photocatalytic CO2-reduction activity of anatase TiO2 by coexposed {0 0 1} and {1 0 1} facets. J Am Chem Soc. 2014;136:8839-42.
- Banerjee S, Mohapatra SK, Das PP, et al. Synthesis of coupled semiconductor by filling 1D TiO2 nanotubes with CdS. Chem Mater. 2008;20:6784-91.
- Biswas S, Hossain MF, Takahashi T, et al. Photocatalytic activity of high-vacuum annealed CdS/TiO2 thin film. Thin Sol Films. 2008;516:7313-7.
