Original Article
, Volume: 5( 3)Relationship between Pc Index and Magnetospheric Field-Aligned Currents Measured by Swarm Satellites
- *Correspondence:
- Troshichev O, Arctic and Antarctic Research Institute, St. Petersburg, Russia, Tel: +78123521223; E-mail: olegtro@aari.ru
Received: October 31, 2016; Accepted: November 30, 2016; Published: December 07, 2016
Citation: Troshichev O, Sormakov D, Behlke R. Relationship between Pc Index, and Magnetospheric Field-Aligned Currents Measured by Swarm Satellites. J Space Explor. 2016;5(3):107.
Abstract
The relationship between the magnetospheric field-aligned currents (FAC) monitored by the Swarm satellites and the magnetic activity PC index (which is a proxy of the solar wind energy incoming into the magnetosphere) is examined. It is shown that current intensities measured in the R1 and R2 FAC layers at the poleward and equatorward boundaries of the auroral oval are well correlated, the R2 currents being evidently secondary in relation to R1 currents and correlation in the dawn and dusk oval sectors being better than in the noon and night sectors. There is evident relationship between the PC index and the intensity of fieldaligned currents in the R1 dawn and dusk layers: increase of FAC intensity in the course of substorm development is accompanied by increasing the PC index values. Correlation between PC and FAC intensities in the R2 dawn and dusk layers is also observed, but it is much weaker. No correlation is observed between PC and field-aligned currents in the midnight as well as in the noon sectors ahead of the substorm expansion phase. The results are indicative of the R1 field-aligned currents as a driver of the polar cap magnetic activity (PC index) and currents in the R2 layer.
Keywords
Magnetospheric field-aligned currents; Auroral oval; PC index of magnetic activity; Magnetospheric substorms
Introduction
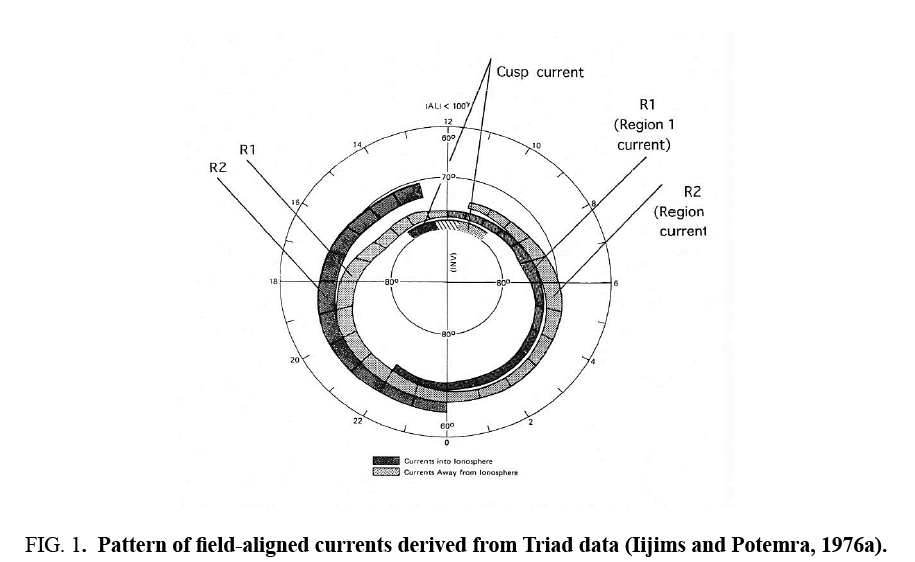
Evidence of magnetospheric field-aligned currents was firstly obtained by Zmuda et al. [1] as the transverse magnetic disturbances ΔB measured on board the OGO 4 spacecraft at altitude of 1100 km. The first field-aligned currents patterns presented by Zmuda and Armstrong [2] were verified by measurements on board the Triad spacecraft [3,4]. The standard pattern of the magnetospheric fieldaligned currents (FAC) includes a layer of currents on the poleward boundary of the auroral oval, flowing into the ionosphere in the dawn side and flowing out of the ionosphere in the dusk side (FAC Region 1), and a layer of currents on the equatorward boundary of the oval (FAC Region 2), with oppositely directed field-aligned currents ( Figure 1 ). Currents in Region 1 are observed permanently, being strongly enhanced for southward interplanetary magnetic field (IMF) [5-7] and the appropriate interplanetary electric field [8]. Currents in region 2 are evident during conditions of magnetic disturbances in the auroral zone (magnetospheric substorms). The current density in R1 FAC system is statistically larger than the current density in R2 system at all local times except the midnight LT sector during substorm periods. Once more FAC pattern (“cusp region”), with current features strongly dependent on the IMF azimuthal component, is observed in the noon sector of the auroral oval. Specific “current wedge” and complex small-scale structures superimposed upon the large-scale FAC currents are typical of the night side auroral oval during substorm expansion phase.
Numerical simulations of the ionospheric electric field and currents generated by field-aligned current patterns were presented by Gizler et al. [9] and Troshichev et al. [10] based on the actual distribution of ionospheric conductivity in the summer polar cap and on satellite data of field-aligned currents [3,4]. The conclusion was made that that different types of the polar magnetic disturbances are produced by various FAC patterns. In particular, the Region 1 currents (strongly related to southward IMF) are responsible for the generation of particular DP2 magnetic disturbances [11-13], for which the equivalent current system is composed, much like the substorm system DP1, of two vortices with currents flowing sunward in the near-pole region. However, unlike substorms, DP2 does not include electrojets in the auroral zone. The foci of the DP2 current vortices are located just at the region 1 FAC maximal intensity at the morning and evening poleward boundaries of the auroral oval [14].
Results of numerical simulations [9,10] have demonstrated that structure of DP2 disturbances in conditions of the well-conductive summer ionosphere is determined by the ionospheric Hall currents, since magnetic effect of the ionospheric Pedersen currents (closing the dawn and dusk parts of the R1 field-aligned currents) is roughly annihilated by distant magnetic effect of the fieldaligned currents, in full agreement with theorem of. However, magnetic disturbances in the winter polar cap, with low-conductive ionosphere, are mainly due to distant effect of the magnetospheric field-aligned currents [10]. The same conclusion was made recently by Laundal et al. [15] while comparing the ground-based magnetic field measurements from SuperMAG [16] with spacebased magnetic field measurements and associated Birkeland currents from AMPERE [17,18] and electric field measurements from Cluster [19].
Examination of the R1 and R2 field-aligned currents observed by AMPERE during substorms was made by Coxon et al. [20] for substorms observed in period of 2010-2012. Being interested in the large-scale morphology of the R1/R2 FAC systems, authors examined the current density along each MLT to identify signatures associated with R1 and R2 currents, then these signatures were integrated over both latitude and longitude, and absolute values of the two total (dawn and dusk) R1 currents were averaged as well as absolute values of the two total R2 currents. A superposed epoch analysis method has been used to derive relationship between the mean intensities of R1 and R2 currents (J1 and J2), oval colatitudes (L1 and L2), dayside reconnection rate ΦD, and geomagnetic indices analogous to the magnetic activity indices AU and AL. The analysis covered the period from 2h before the substorm onset (T=0) to 2 h after. It was found that the current ovals expand and contract over the course of a substorm cycle and that currents increase in magnitude approaching substorn onset and are further enhanced in the expansion phase.
The PC index has been introduced [21,22] to characterize the polar cap magnetic activity affected by geoeffective solar wind parameters, such as the southward and azimuthal IMF components. The concept of the DP2 magnetic disturbances controlled by the interplanetary electric field EKL, served as the basis for the PC index derivation with the EKL quantity being determined by formula of Kan and Lee [23].
EKL=Vsw [BY2 + BZ2]1/2 sin2(θ/2) (1)
Where Vsw is the solar wind velocity, BY and BZ are the IMF the azimuthal and vertical components, and Θ is a clock angle
between the IMF tangential component and the geomagnetic dipole. The polar cap magnetic activity is determined as the magnitude of the DP2 magnetic disturbances (δF) at the near-polar stations Quanaaq (Thule) in Greenland and Vostok in Antarctica:
δF = δHsinγ + δDcosγ (2)
where δH and δD are deviations of magnetic horizontal components from the quiet level, and angle γ is designated to estimate the EKL influence effect in deviations δH and δD. The PC index is calculated on-line by current data on δF using statistically justified coefficients for the linear regression α (slope) and β (intersection) linking the quantities δF and EKL
PC = (δF - β)/α (3)
The regression coefficients are derived, with 5 min resolution, for any UT moment of each day of the year on the basis of δF and EKL data sets for 1995-2005 [24].
The PC index was endorsed at the XXII IAGA Scientific Assembly (Mexico, 2013) as a proxy for energy that enters into the magnetosphere during solar wind-magnetosphere coupling. The following experimental facts are indicative of this statement [25,26], the PC index responds to the EKL field variations with time delays ΔΤ lying in the range of 8 to 24 minutes with ΔΤ being dependent on the EKL growth rate (dEKL/dt); magnetic substorms start during gradually increasing PC index, the substorm sudden onsets (SO) are preceded by a distinct PC value leap observed 1-15 min ahead of SO, the great majority of substorms (>75%) occur under conditions PC>1.5 mV/m, the intensity of magnetic disturbances in the auroral zone (AL index) is linearly related to the PC value before as well as after the substorm onset; the magnetic storms start when the EKL field steadily exceed the threshold >1.5 mV/m and decay if EKL and PC firmly descent below this level, the maximal storm intensity (DstMIN) being linearly related to the values PCMAX averaged for the time interval from the storm beginning to the storm maximum.
In this paper, we examine, for the first time, the relationship between the PC index and the magnetospheric field-aligned currents. We used FAC data which are the official product of the ESA’s Swarm mission launched in November 2013 into a near polar orbit [27]. The final constellation of the three-satellite mission was achieved on 17 April 2014, the two satellites, Swarm A and Swarm C, being flown side by side, separated by 1.4° in longitude at an altitude of about 460 km. The method of FAC derivation from two spacecraft has been given [28]. More details about the Swarm current density estimation are presented [29-31].
Owing to their orbital configurations the Swarm satellites cover all sectors of the auroral zone through the year and provide information on the field-aligned currents in different LT intervals. The aim of the study is to reveal the PC index relation to the current intensity in the R1/R2 FAC systems in course of the substorm growth phase preceding the substorm sudden onset.
Method of the Analysis
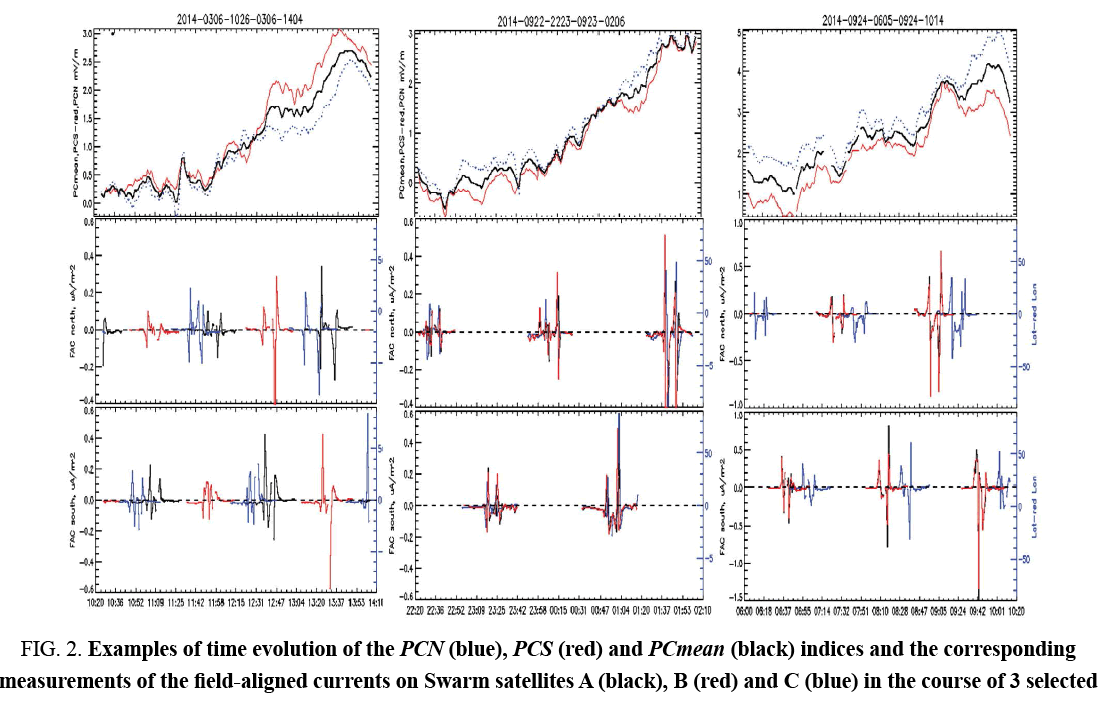
It should be noted that the PC index, as indicator of polar cap magnetic activity, can be affected not only by the R1/R2 FAC patterns, but also to such FAC systems, as the NBZ field-aligned currents happened within the polar cap during the magnetic quiescence, and the “current wedge” (and other small-scale FAC structures) typical of the nighttime auroral oval during the substorm expansion phase. To eliminate a possible effect of these currents and to reveal a regular relationship between the R1/R2 FAC intensity and the PC index behavior, we restricted our examination to the isolated substorms that started from a quiet magnetic field background. Taking into account that magnetic substorm onsets are always preceded by a PC-index growth [26], we chose isolated substorms with steadily rising PC index during the growth phase. This allows us to correlate the PC index increase with the intensity of the R1/ R2 field-aligned currents before the substorm sudden onset, and, therefore, ahead of the development of the FAC systems responsible for the substorm expansion phase (as distinct from study of Coxon et al.) [20]. Figure 2 shows typical examples for the time evolution of the PCN (blue), PCS (red) and PCmean (black) indices (upper panel) and the appropriate measurements of the field-aligned currents on Swarm satellites A(black), B(red) and C(blue) in the northern (2th panel) and southern (3th panel) polar caps in the course of selected substorms. Positive FAC values in Figure 2 are assigned for downward (flowing into ionosphere) field-aligned currents, the negative FAC values are assigned for upward (flowing out of the ionosphere) currents. This analysis only includes those events, when all satellites detected significant FAC signal. Events where only one satellite has signatures in FAC are not considered. In case of multi-layered current structures, the first and last current layers (i.e. the layers located at the poleward and equatorward boundaries of the auroral oval) were examined.
Figure 2: Examples of time evolution of the PCN (blue), PCS (red) and PCmean (black) indices and the corresponding measurements of the field-aligned currents on Swarm satellites A (black), B (red) and C (blue) in the course of 3 selected substorms.
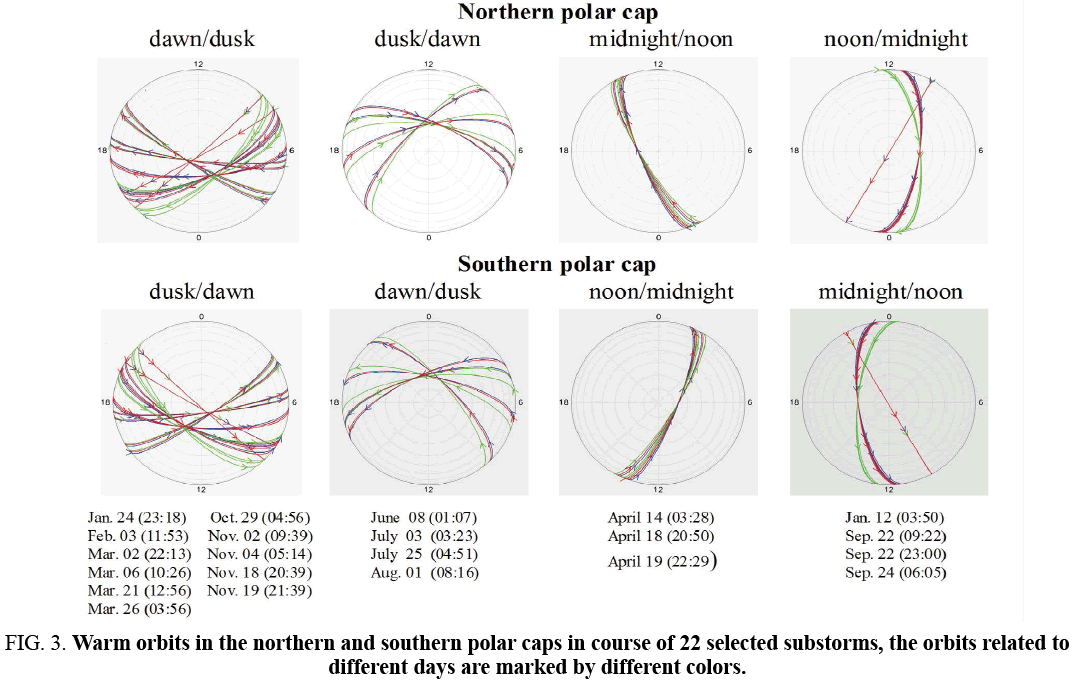
The data on field-aligned currents measured by Swarm satellites in 2014 have been examined and 22 isolated substorms satisfying the above described criteria have been chosen for analysis. Figure 3 shows the Swarm crossings of the northern and southern polar caps in the course of these 22 substorms, the orbits related to different days being marked by different colors. One can see that measurements of the Regions 1 and 2 FAC were performed in all MLT sectors over the year. Since three Swarm satellites intersected the polar caps 3-5 times in course of a single substorm ( Figure 2 ) and each polar cap intersection included 2 crossings the R1/R2 FAC layers, the total number of R1/R2 FAC layers crossings during 22 substorm events turned to be exceeded 500. This number was reduced to 460 owing to exception of multi-layers’ current structures of unclear nature and random outliers in FAC measurements. Data on the maximal positive and negative FAC quantities measured by the Swarm satellites while these 460 crossings were compared with the appropriate (related to the UT moment of layer crossing) the PC indices.
Figure 3: Warm orbits in the northern and southern polar caps in course of 22 selected substorms, the orbits related to different days are marked by different colors.
Results of the Analysis
Correlation between the field-aligned currents intensity in regions 1 and 2
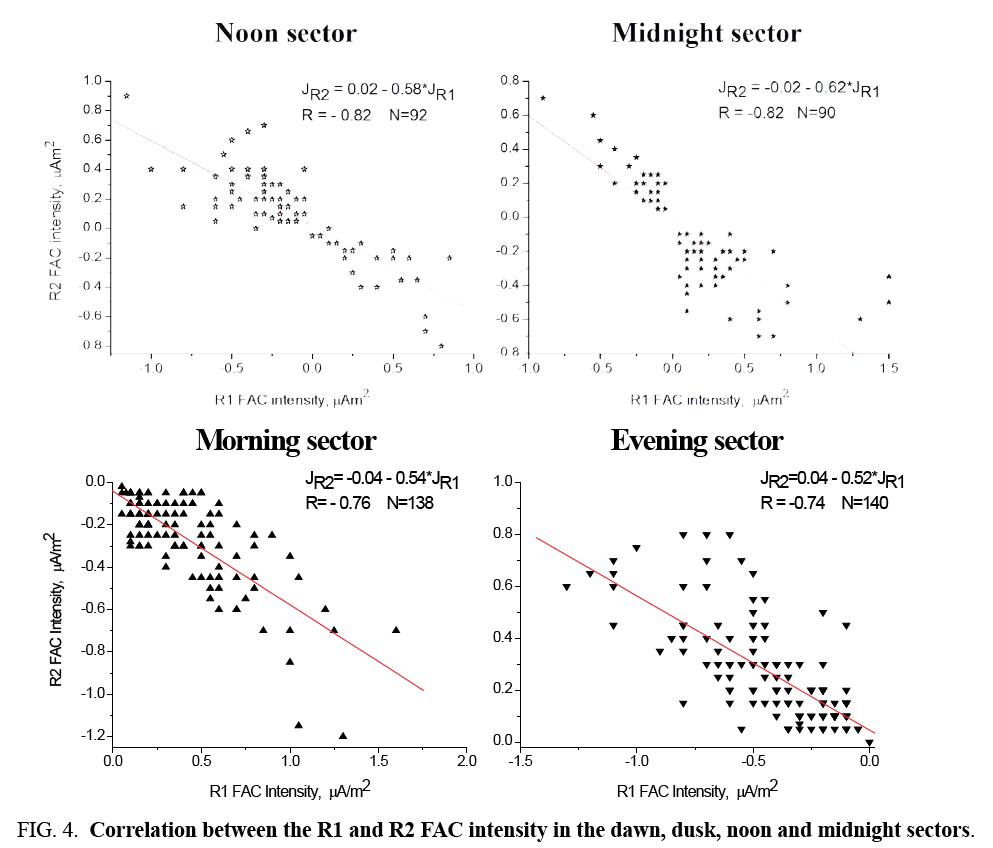
The FAC intensities in the R1 and R2 layers determined by the Swarm satellites were examined separately for morning, evening, noon, and midnight sectors. The corresponding relationships between the R1 and R2 FAC intensities are shown in Figure 4 . One can see that the field-aligned currents in the morning sector of the auroral zone are always downwards (flowing into the ionosphere) in region 1 and always upwards (flowing out of the ionosphere) in Region 2. Field-aligned currents in the evening sector of auroral zone are always upwards (flowing out of the ionosphere) in Region 1 and always downwards (flowing into the ionosphere) in Region 2. Field-aligned currents in the noon and midnight sectors in Region 1 and Region 2 FAC layers can be positive as well as negative, the downwards currents in Region 2 being always related to upward currents in Region 1, and vice versa. The intensity of the fieldaligned currents in Region 1 and Region 2 are well correlated, the FAC intensity in Region 1 being nearly twice as large as that in Region 2. It implies that the field-aligned currents in Region 2 are secondary in relation to R1 currents, which should be regarded as responsible for generation of electric fields and currents in the well conductive auroral ionosphere.
Figure 4: Correlation between the R1 and R2 FAC intensity in the dawn, dusk, noon and midnight sectors.
Relationship between Pc and R1/R2 field-aligned currents in the dawn/dusk sector
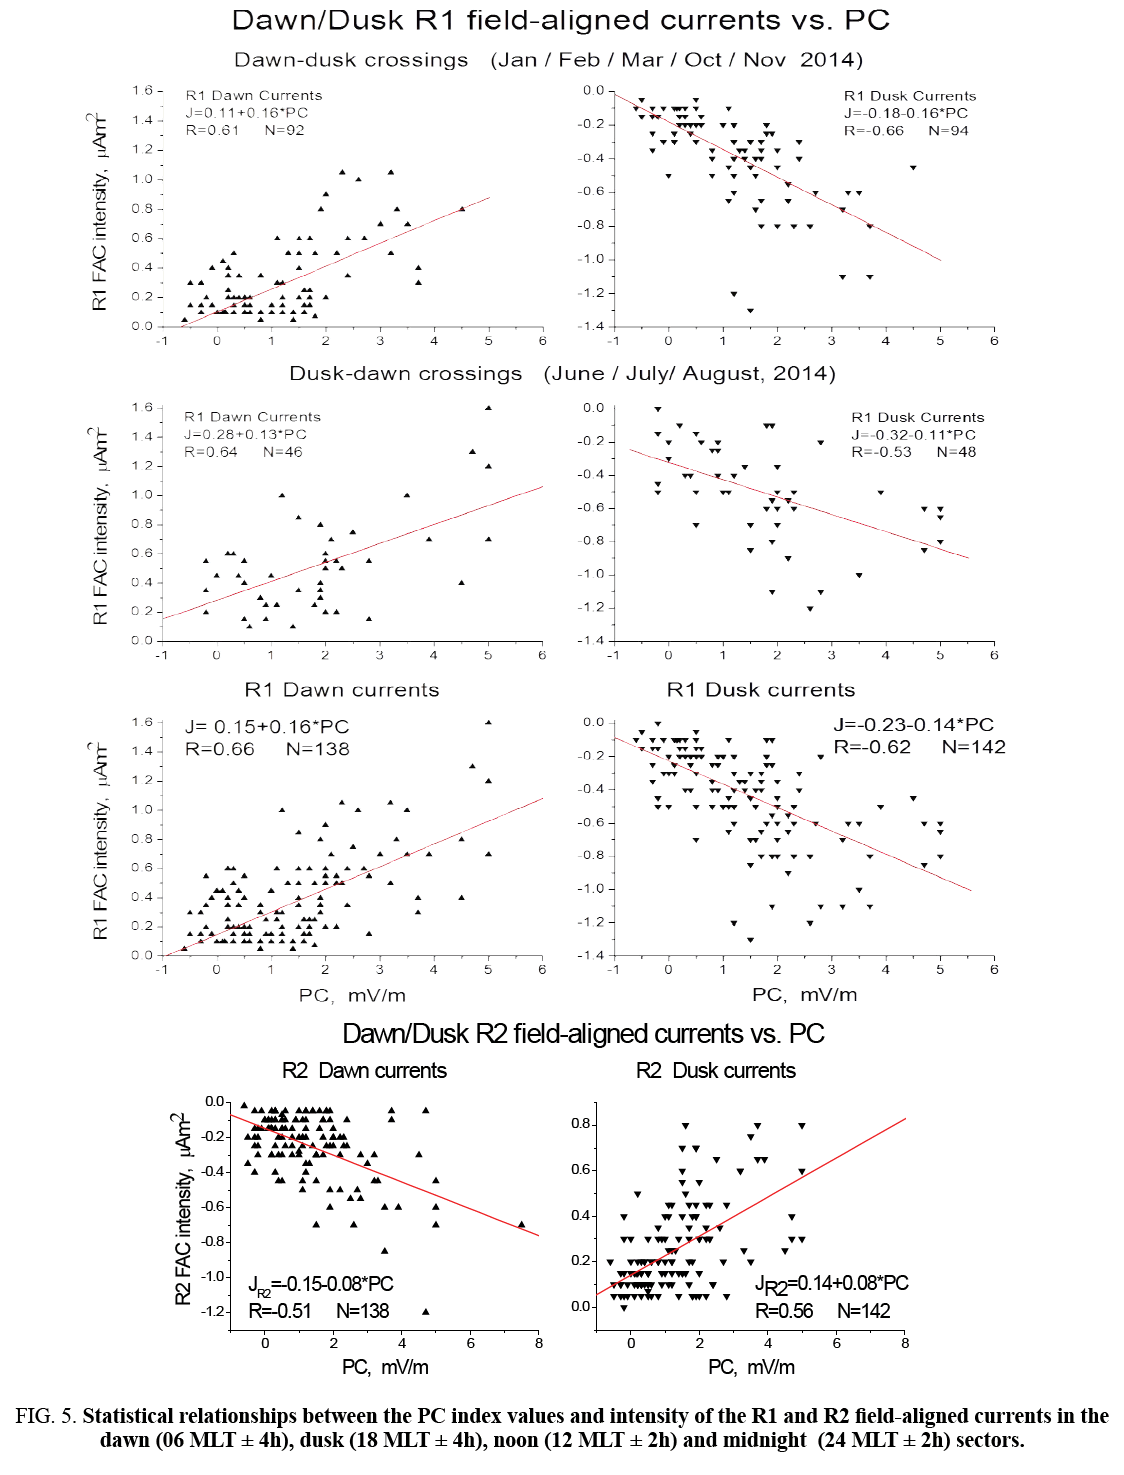
The time evolution of the PC index and the R1 FAC intensity in the course of individual substorm events ( Figure 2 ) shows that increase of the R1 FAC intensity in the dawn/dusk sectors is accompanied by growth of the PC index. Moreover, occasional drops in the FAC intensity are followed by a short-term PC decay. The statistical relationship between the PC values and intensities of the R1 and R2 field-aligned currents in the dawn (06 MLT ± 4h) and dusk (18 MLT ± 4h) sectors are shown in FIG 5a and 5b. The downwards currents (flowing into the ionosphere) and upwards currents (flowing out of the ionosphere) are regarded as positive and negative currents, correspondingly. As Figure 5a shows, the PC value evidently correlates with the intensity of the R1 field-aligned currents in the morning as well as in the evening sector of the auroral zone. A certain degree of dispersion is expected in the relationship: the PC index represents the magnetic effect related to the integral intensity of the field-aligned currents in both the dawn and dusk sectors of the R1 FAC layer, whereas the field-aligned current measurements are measured only in one point, where satellite orbit intersects the layer. The current intensity in other points of the layer is possibly quite different at the same time. Moreover, the PC derivation method eliminates effects of the IMF BY component in the polar cap magnetic activity, whereas the Swarm measurements include this effect. The correlation between PC and FAC intensity is lower in the evening sector (R=-0.62) than in the morning one (R=0.66), and this peculiarity can be assigned to the larger dispersion of the data with higher PC index values which is typical of the evening sector.
Figure 5: Statistical relationships between the PC index values and intensity of the R1 and R2 field-aligned currents in the dawn (06 MLT ± 4h), dusk (18 MLT ± 4h), noon (12 MLT ± 2h) and midnight (24 MLT ± 2h) sectors.
Since field-aligned currents in R1 and R2 layers are well correlated in both morning and evening sectors, there is reason to believe that the intensity of currents in the R2 layer should be also related to the PC index. Indeed, a correlation between PC and R2 FAC intensity, while not so good, is observed ( Figure 5b ), with the correlation in the evening sector being lower (R=-0.51) than that in the morning sector (R=0.56). We suppose that larger dispersion of data in the evening sector and, correspondingly, the lower correlation between PC and the dusk field-aligned currents is due to the effect of “current wedge”, which is displaced towards dusk relative to the midnight meridian.
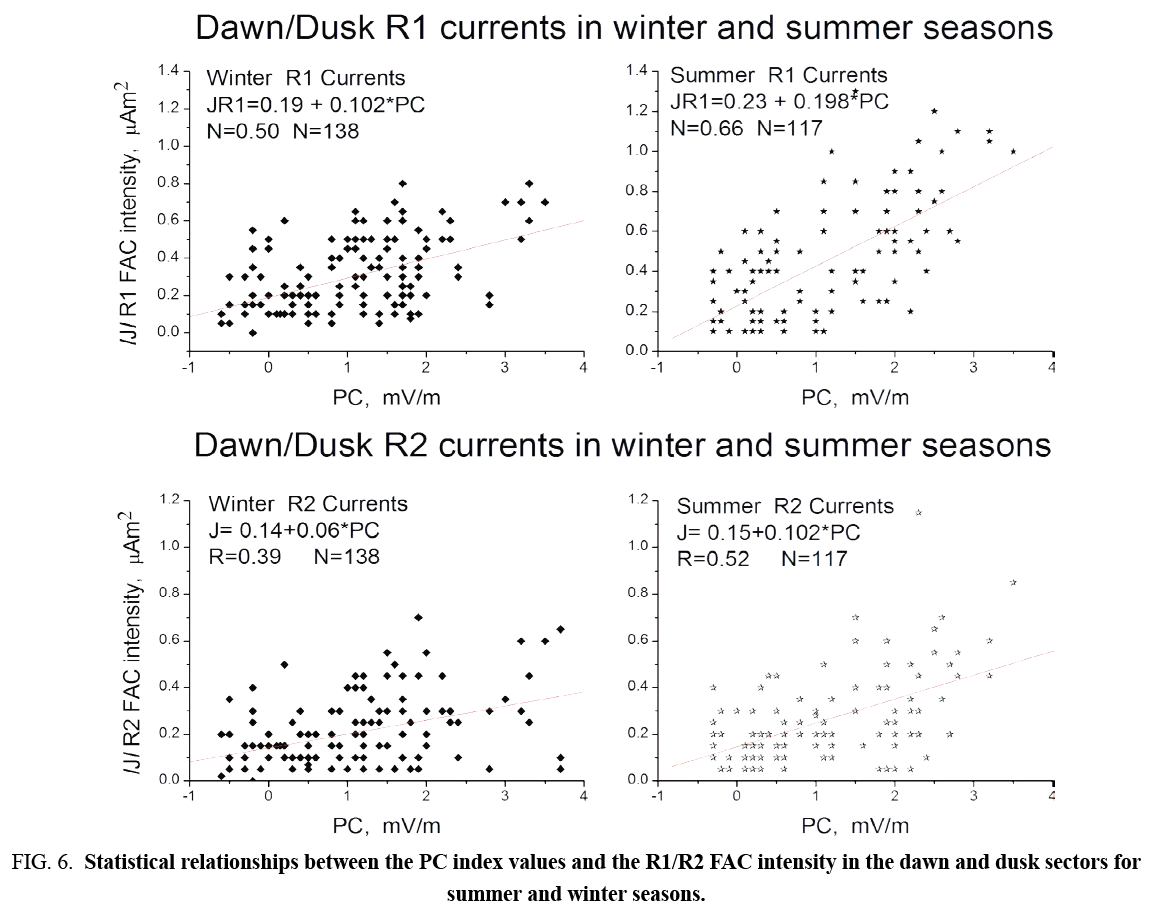
The availability of the satellite orbits crossing the southern and northern polar caps in various months of 2014 makes it possible to examine a season effect in relations between PC and field-aligned currents. Combining the data of Swarm measurements in opposite hemispheres by local seasons we received the relationships presented in Figure 6 . In this case, we excluded the intervals with PC>3.5 mV/m from examination, which are evidently related to the substorm expansive phase associated with auroral particle precipitation and a sharp increase of the corresponding ionospheric conductivity. The results presented in Figure 6a demonstrate that the linear relationship between the PC values and the R1 FAC intensity is different for summer and winter seasons: the R1 FAC intensity in the summer polar cap is about twice as high as in the winter cap under conditions of the same PC index. The similar, but much weaker regularity is typical for the R2 FAC layer ( Figure 6b ).
Figure 6: Statistical relationships between the PC index values and the R1/R2 FAC intensity in the dawn and dusk sectors for summer and winter seasons.
Relationship between Pc and field-aligned currents in the noon/night sectors
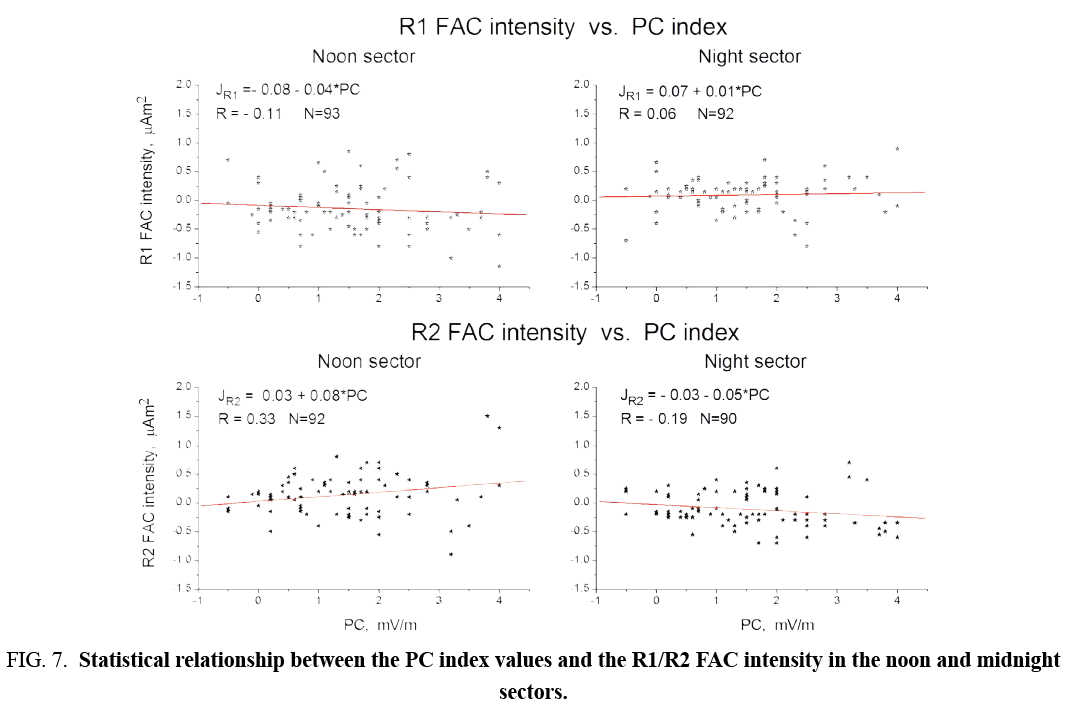
FIG 7a and 7b shows relationship between values of PC and intensity of the R1 and R2 field-aligned currents measured by SWARM satellites in the noon (12 MLT ± 2 h) and midnight (24 MLT ± 2 h) sectors. One can see that both downwards and upwards fieldaligned currents are observed in the R1 as well as in the R2 FAC layers in the noon and night sectors, in contrast to the field-aligned currents in the dawn and dusk sectors, where the FAC direction (downward or upward) is strongly regulated by layer (R1 or R2) and sector (morning or evening). Correspondingly, the PC index does not correlate with the R1 and R2 FAC intensities in the noon and midnight (coefficients of correlation lie in the range of |R|=0.06 to |R|=0.22) ( Figure 8 ).
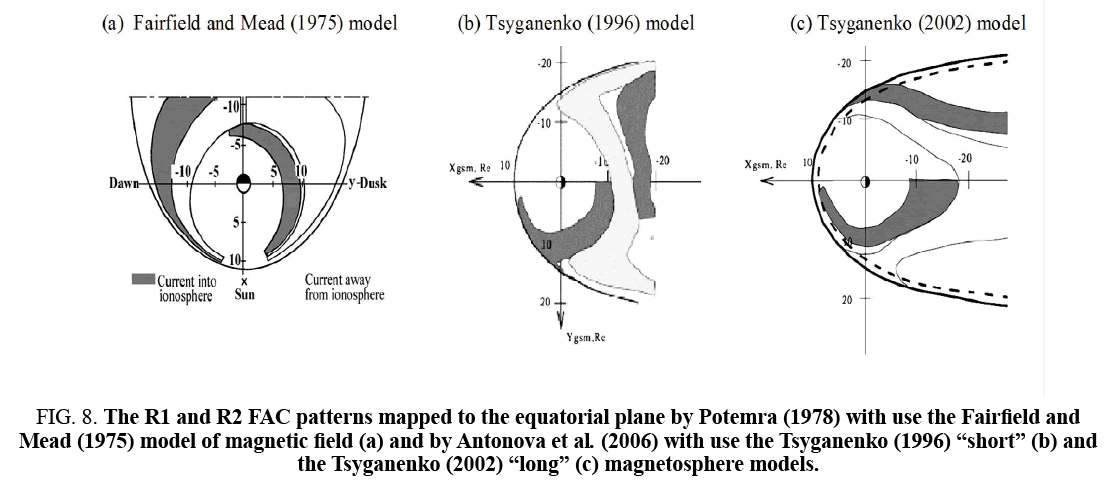
Figure 8: The R1 and R2 FAC patterns mapped to the equatorial plane by Potemra (1978) with use the Fairfield and Mead (1975) model of magnetic field (a) and by Antonova et al. (2006) with use the Tsyganenko (1996) “short” (b) and the Tsyganenko (2002) “long” (c) magnetosphere models.
Discussion
The analysis demonstrates that the FAC intensities measured by the Swarm satellites in the R1 and R2 layers are well correlated in the dawn and dusk sectors, as well as in the noon and night sectors of the auroral oval. Intensity of R1 currents in all sectors (dawn, dusk, noon, midnight) is ~1.65 times larger than intensity of R2 currents, indicating convincingly that the R2 currents are secondary in relation to R1 currents. This result is in agreement qualitatively, but not quantitatively, with results of Coxon et al. [20], which demonstrate excess of R1 currents above R2 currents in range of 1.05 ÷ 1.2. We suggest that this inconsistency might be a result of total averaging the FAC characteristics made by Coxon et al. [20].
It should be noted a certain similarity between the EKL field and the dayside reconnection rate ΦD [32].
ΦD = Leff Vx [BY2 + BZ2]1/2 sin9/2(θ/2) (4)
used in Coxon et al. [20], indeed if we compare expression (1) and (4) we found that ΦD=LeffEKLsin5/2(θ/2), Where Leff is an effective length scale. Therefore, we can expect a certain agreement between our results and results of Coxon et al. [20]. Indeed both studies demonstrate that current intensity in R1/R2 layers increases along with PC (ΦD) while approaching the substorm onset. However, as distinct from Coxon et al. [20] who examined the averaged over the layers R1/R2 FAC characteristics, we can assert that evident increase of FAC intensity in course of substorm development occurs only in the dawn and dusk FAC layers ( Figure 5 ). As this takes place, the R1 field-aligned current intensification is accompanied by evident PC growth, whereas correlation between PC and R2 FAC intensities in the dawn and dusk layers is much weaker and seems to be a consequence of high correlation between R1 and R2 currents. Our results demonstrate ( Figure 7 ) that the R1/R2 currents in the noon and midnight sectors do not correlate with PC index at all. It implies that field-aligned currents in these sectors are not related with substorm development in course of the growth phase i.e. before the substorm sudden onset) and, therefore, closure of nighttime FAC through the ionosphere is a distinguishing feature exclusively of the substorm expansion phase.
Figure 7: Statistical relationship between the PC index values and the R1/R2 FAC intensity in the noon and midnight sectors.
As results of Troshichev et al. [10] and Laundal et al. [15] show, the polar cap magnetic disturbances in conditions of the sunlight well-conductive ionosphere are generated mainly by Hall currents, which are actual horizontal ionospheric currents caused by actual R1 field-aligned currents in the dawn and dusk sectors of the auroral oval, whereas magnetic disturbances in the dark winter polar cap with low-conductive ionosphere are mainly due to distant effect of actual field-aligned currents. Thus, magnetospheric field-aligned currents serve as a driver of the polar magnetic disturbances irrespective of conductivity of the polar cap ionosphere. As this takes place, the Region 1 FAC intensity is seasonally dependent [33,34] since the summer high-conductive polar cap ionosphere provides the better conditions for closing the field-aligned currents than the winter ionosphere. As a result, the polar cap magnetic activity being powered by the field-aligned currents (and, therefore, by the solar wind) turns out to be controlled also by the ionospheric conductivity, which is maintained by the solar UV irradiation and is subjected to MLT and seasonal variations. The PC index is designated to estimate the only solar wind impact on the polar cap magnetic activity. In order to exclude the effects of ionospheric conductivity, the PC index is calculated with reference to quiet daily magnetic variation and with allowance for statistically justified coefficients α and β, which determine a link between EKL field and magnetic disturbance δF for each moment of any day of the year (see introduction). It means that the same values of PC index can be related to different intensities of the field-aligned currents in the summer and winter polar caps. It is just regularity that is observed in Figure 6 : for the same PC value the R1 FAC intensity in the summer polar cap is about twice as higher as in the winter cap.
The results of Coxon et al. [20] are indicative of strong relation of the R1 field-aligned currents to the dayside reconnection rate ΦD. Our results are indicative of strong relation of field-aligned currents to the polar cap magnetic activity (PC index). Following Dungey’s concept, Coxon et al. [20] explain the relationship between R1 FAC and ΦD by magnetic reconnection between the interplanetary magnetic field and terrestrial field lines at the magnetopause, creation of open magnetic flux interconnecting the interplanetary medium to the polar regions, motion of the open flux tubes from the dayside to the night side, and subsequent reconnection of the open field lines in the magnetosphere tail, which drives under the certain conditions the substorm development [35]. According to our point of view [36] the R1/R2 field-aligned currents are generated within the magnetosphere in course of solar wind-magnetosphere interaction. Results of these experimental studies give evidence of plasma pressure gradients in the magnetosphere as the driving force for both R1 and R2 FAC systems.
It should be noted that examination of relationships between R1/R2 field-aligned currents and PC index, as well as between R1/ R2 field-aligned currents and reconnection rate ΦD, cannot answer by itself what mechanism is responsible for the R1/R2 FAC generation. To solve the problem another evidences should be taken into account. In this connection we would like to draw attention to results of the R1/R2 FAC mapping to the equatorial plane. Such analysis was fulfilled by Potemra [37] with use of the Fairfield and Mead [38] model of magnetic field, and by Antonova [39] with use of the “short” and “long” advanced magnetosphere models of Tsyganenko [40,41]. Results of all mappings demonstrate, in spite of difference in models, that both R1 and R2 field-aligned current systems are located in the closed magnetosphere. The same conclusion was made by Chan and Russel when analyzing the data on field-aligned currents measured by ISEE 1 and 2 satellites at altitudes 2-9 RE. It means that generators of the R1/R2 FAC systems are positioned within the closed magnetosphere, not on the dayside magnetopause.
Furthermore, measurements of magnetic field and plasma parameters made in the dayside magneto-layer (the region separating magnetopause from bow shock) are indicative of turbulent properties of plasma inside the layer and inconsistency between the magnetic field polarities on the inner and outer magneto-layer boundaries [42,43]. These experimental facts are in conflict with Dungey’s concept which postulates the immediate contact between geomagnetic and interplanetary magnetic fields at the dayside magnetopause and, as a result, their interconnection. Thus, making allowance to the sum total of the experimental facts we come to conclusion that the polar cap magnetic activity (PC index) is initiated by the field-aligned currents which are generated within the magnetosphere in response to the solar wind action.
Conclusions
Analysis of relationship between the PC index and field-aligned currents measured by Swarm satellites has demonstrated that increase of FAC intensity in dawn and dusk sectors of the poleward auroral oval boundary (R1 FAC layer) in course of substorm development is evidently accompanied by the PC growth. The currents on the equatorward oval boundary (R2 FAC layer) seem to be secondary in relation to R1 currents. Correlation between PC and field-aligned currents in the midnight as well as in the noon sectors was not found during the substorm growth phase. These results are indicative of the R1 field-aligned currents as a driver of the polar cap magnetic activity (PC index) and currents in the R2 layer.
Acknowledgments
Swarm data is publicly available from https://earth.esa.int/web/guest/swarm/data-access. The authors thank Claudia Stolle and Jürgen Matzka for fruitful discussions.
References
- Zmuda AJ, Martin JH, Heuring FT. Transverse magnetic disturbancesat 1100 km in the auroral zone. J Geophys Res. 1966;71(21):5033-45.
- Zmuda AJ, Armstrong JC. The diurnal flow pattern of field-aligned currents. J Geophys Res. 1974;79:4611-19.
- Iijima T, Potemra TA. The amplitude distribution of field-aligned currents of northern high latitudes observed by Triad. J Geophys Res. 1976;81:2165-74.
- Iijima T, Potemra TA. Field-aligned currents in the dayside cusp observed by Triad. J Geophys Res. 1976;81:5971-79.
- Langel RA. Relation of variations in total magnetic field at high latitude with parameters of the IMF and with DP2 fluctuations. J Geophys Res. 1975;80:1261-70.
- Diarmid IB, Burrows JR, Wilson MD, et al. Reverse polarity field-aligned currents at high latitudes. J Geophys Res. 1977;82:1513-18.
- Iijima T, Potemra TA. The relationship between interplanetary quantities and Birkeland current densities. Geophys Res Lett. 1982;4:442-5.
- Bythrow PF, Potemra TA. The relationship of total Birkeland currents to the merging electric field.Geophys Res Lett. 1983;10(7):573-76.
- Gizler VA, Semenov VS, Troshichev OA. The electric fields and currents in the ionosphere generated by field-aligned currents observed by TRIAD. Planet Space Sci. 1979;27:223-31.
- Troshichev OA, Gizler VA, Ivanova IA, et al.Role of field-aligned currents in generation of high latitude magnetic disturbances. Planet Space Sci. 1979;27:1451-59.
- Obayashi T. The interaction of solar plasma with geomagnetic field, disturbed conditions. In: King JW, Newman WS, editor.Newyork: Solar terrestrial physics; 1967.107.
- Nishida A. Geomagnetic DP2 fluctuations and associated magnetospheric phenomena. J Geophys Res. 1968;73:1795-1803.
- Nishida A. Coherence of geomagnetic DP2 fluctuations with interplanetary magnetic variations. J Geophys Res. 1968;73:5549-59.
- Troshichev OA, Polar magnetic disturbances and field-aligned currents. Space Sci Rev. 1982;32:275-360
- Laundal KM, Haaland SE, Lehtinen N, et al. Birkeland current effects on high-latitude ground magnetic field perturbations. Geophys Res Lett. 2015;42(18):7248-54.
- Gjerlov JW. The superMAG data processing technique. J Geophys Res. 2012:117(A9).
- Anderson BJ, Takahashi K, Toth BA. Sensing global Birkeland currents with Iridium engineering magnetometer data. J Geophys Res Lett. 2000;27(24):4045-48.
- Waters CL, Anderson BJ, Liou K.Estimation of global field-aligned currents using the Iridium system magnetometer data, Geophys Res Lett. 2001;28(11):2165-68.
- Pashmann G, Melzner F, Frenzel R, et al. The electron drift instrument for Cluster.Space Sci Rev. 1997;79(1):233-369
- Coxon JC, Milan SE, Clausen LBN, et al.A superposed epoch analysis of the Region 1 and 2 Birkeland currents observed by AMPERE during substorms. J Geophys Res Space Phys. 2014;119(12):9834-46.
- Troshichev OA, Andrezen VG. The relationship between interplanetary quantities and magnetic activity in the southern polar cap. Planet Space Sci. 1985;33(4):415-9.
- Troshichev OA, Andrezen VG, Ennerstrøm SV,et al.Magnetic activity in the polar cap: A new index. Planet Space Sci. 1988;36(11):1095-102.
- Kan JR, Lee LC. Energy coupling function and solar wind-magnetosphere dynamo. GeophysRes Lett. 1979;6(7):577-80.
- Troshichev OA, Podorozhkina NA, Janzhura AS.Invariability of relationship between the polar cap magnetic activity and geoeffective interplanetary electric field. Ann Geophys. 2011;29(8):1479-89.
- Troshichev O,Sormakov D, Janzhura A. Relation of PC index to the geomagnetic storm Dst variation. J Atmos Solar-Terr Phys. 2011;73(5):611-22.
- Troshichev OA, Sormakov DA. PC index as a proxy of the solar wind energy that entered into the magnetosphere: 2. Relation to the interplanetary electric field EKL, before substorm onset. Earth Planets Space. 2015;67:170.
- Olsen N, Friis EC, Floberghagen R, et al. The swarm satellite constellation application and research facility (SCARF) and swarm data products. Earth Planets Space. 2013;65(1):1189-1200.
- http://www.terrapub.co.jp/journals/EPS/pdf/2013/6511/65111285.pdf
- Ritter P, Luhr H, Rauberg. Determining field-aligned currents with the Swarm constellation mission. J Earth Planet Sp. 2013;65:9.
- LührH,ParkJ,GjerloevJWetal.Field-alignedCurrents’ScaleAnalysisPerformedwiththeSwarmConstellation.GeophysResLett.2015;42:1-8.
- Lühr H, Kervalishvili G, Michaelis I, et al. The inter-hemispheric and F-region dynamo currents revisited with the Swarm constellation, Geophys Res Lett. 2015;42:3069-75.
- Milan SE, Gosling JS, Hubert B. Relationship between interplanetary parameters and the magnetopause reconnection rate quantified from observations of the expanding polar cap. J Geophys Res. 2012;117(A3).
- Fujii R, Iijima T, Potemra TA, et al. Seasonal dependence of large-scale Birkeland currents. Geophys Res Lett. 1981;8(10):1103-06.
- Ohtani S, Ueno G, Higuchi T, et al. Annual and semiannual variations of the location and intensity of large-scale field-aligned currents. J Geophys Res. 2005;110(A1).
- Dungey JW. Interplanetary magnetic field and the auroral zones. Phys Rev Lett. 1961;6(2):47.
- Troshichev OA, Janzhura AS. Space weather monitoring by ground-based means: PC index. Germany: Springer-Verlag Berlin Heidelberg; 2012. 288.
- PotemraTA, IijimaT. Large-scale characteristics of field-aligned currents associated with substorms. J Geophys Res. 1978;83(2):599-615.
- Fairfield DH, Mead GD. Magnetospheric mapping with a quantitative geomagnetic field model. J Geophys Res. 1975;80:535.
- AntonovaEE, KirpichevIP, StepanovaMV. Field-aligned current mapping and the problem of the generation of magnetospheric convection. Adv Space Res. 2006;38:1637-41.
- TsyganenkoNA,SternDP. Modeling the global magnetic field of the large-scale Birkeland current systems. J Geophys Res. 1996;101:27187-98.
- TsyganenkoNA. A model of the near magnetosphere with a dawn-dusk asymmetry. J GeophysRes. 2002;107:8.
- Antonova EE, Pulinets MS, Riazantseva MO, et al. Turbulence in the magnetosheath and the problem of plasma penetration inside the magnetosphere. In: Lazar M, editor.Exploring the solar wind. Croatia: Intech. 2012;417-38.
- Pulinets MS, Antonova EE, Riazantseva MO, et al. Comparison of the magnetic field before the subsolar magnetopause with the magnetic field in the solar wind before the bow shock. Adv Space Res. 2014;54(4):604-16.
