Original Article
, Volume: 11( 2)Prediction of Efficacy of Oligo-Peptides using QSAR and ANN
- *Correspondence:
- Rana D Department of Chemical Engineering, Institute of Chemical Technology, Mumbai, Mumbai, (MH)-0400019, India
Tel: +91 9969934044; E-mail: dhruvrana27@gmail.com
Received Date: April 11, 2017 Accepted Date: April 26, 2017 Published Date: April 30, 2017
Citation: Rana D, Sangave P, Bhagwat S. Prediction of Efficacy of Oligo-Peptides using QSAR and ANN. Biochem Ind J. 2017;11(2):115.
Abstract
Artificial Neural Network (ANN) is statistical learning models inspired by biological neural networks. The research work presented here mainly focused on use of ANN for quantitative structure activity relationship modeling of peptides. Some peptides can work as anti-depressing agents, as they reduce the activity of Angiotensin I Converting Enzyme (ACE), which converts Angiotensin I to Angiotensin II (a vasoconstrictor). In this work, we have used LogIC50 as the property to show the activity of peptides against ACE. The networks are prepared using the principle artificial neural network using SNNS (Stuttgart Neural Network Simulator). The best obtained network for di-peptides has architecture of 24-8-3-1 and the average absolute average errors obtained are 0.34, 0.42 and 0.58 for training, validation and test set respectively.
Keywords
Artificial Neural Networks; Dipeptides; Angiotnesin I-converting enzyme; Anti-hypertensive agents
Introduction
Chemical structure can define all the physical, chemical, biological and thermodynamic properties of a compound. Quantitative relationship between biological/chemical effects (i.e., the activity) and the chemistry (i.e., structure) of each of the compounds is called quantitative structure-activity relationship or QSAR.
Artificial neural networks are computational models inspired by animals’ central nervous systems (in particular the brain) that are capable of machine learning and pattern recognition. Artificial neural networks (ANNs) are based on a concept that a highly-interconnected system of simple processing elements is able to learn complex relationships between independent and dependent variables. ANNs are parallel processing units, massively interconnected, containing processing elements called neurons [1].
In pharmaceutical research, QSAR is used in the pre-clinical stages of drug discovery which replaces the tedious and costly experimentation, filter large chemical databases, and help in selecting the right drug candidates. QSAR methods in drug design are mainly used for estimation of drug physico-chemical properties, biological effects as well as the physico-chemical properties which controls the biological activity. Hence, QSAR is low-cost method for selection of hits and lead optimization during drug design [2].
Pharmaceutical companies have started performing toxicity testing as well as ADME studies, in early stages of drug development. Computer-based models are generally used to predict the toxicity before the synthesis of the drug candidate. QSAR is used as prediction model as long as the parameters responsible for toxicity are in chemical parameter space of the model [2].
In this study, we have tried to predict the efficacy of dipeptides against Angio-tensin Converting Enzyme (ACE) using QSAR. We have used Artificial Neural Network (ANN) to model the non-linear relationship between the activity of peptides and their molecular structure.
Materials and Methods
Preparation of dataset
Descriptors for amino acids: Individual amino acid is characterized by three z-scores namely, z1 , z2 and z3 calculated by principal component analysis. Data is taken from literature [3]. A new set of twelve descriptors, HSEHPCSV (component score vector of hydrophobic, steric and electronic properties together with hydrogen bonding contributions) is obtained from literature [4]. These descriptors are utilized as inputs of the neural network.
Log IC50 values of peptides for the inhibition of ACE: The Log IC50values of different di-peptides is collected from the literature [5]. The Log IC50 of 168 di-peptides is used. The values are tabulated in Table 1 for di-peptides, in which in-vivo tested peptides are highlighted in bold.
Pre-processing of dataset
| Peptide | Log IC50 | Peptide | Log IC50 | Peptide | Log IC50 | Peptide | Log IC50 |
|---|---|---|---|---|---|---|---|
| IY | 0.57 | YP | 2.95 | DY | 2.00 | YG | 3.04 |
| QK | 2.95 | IY | 0.32 | LY | 0.83 | MF | 1.65 |
| RY | 1.71 | MY | 2.29 | LY | 1.59 | KW | 0.21 |
| TF | 1.25 | LY | 0.81 | YL | 1.21 | AF | 1.18 |
| VF | 0.96 | AY | 1.28 | FP | 2.50 | VW | 0.15 |
| YW | 1.02 | HY | 1.42 | RF | 1.97 | GG | 3.94 |
| GY | 2.41 | IY | 0.38 | PR | 0.61 | RY | 1.02 |
| AW | 1.08 | IY | 0.36 | LW | 0.83 | SY | 1.82 |
| GY | 1.86 | NY | 1.51 | SF | 2.11 | GF | 2.44 |
| NF | 1.67 | LW | 1.70 | YP | 2.86 | YG | 3.18 |
| LF | 2.54 | YL | 2.09 | RP | 1.32 | GP | 2.56 |
| GP | 3.08 | TP | 2.46 | VP | 2.76 | GI | 3.11 |
| DF | 2.56 | NP | 3.36 | DM | 2.78 | DL | 3.30 |
| GY | 2.42 | VY | 1.20 | GF | 2.85 | VW | 0.20 |
| DG | 1.09 | FQ | 1.71 | VY | 1.41 | TF | 195 |
| LY | 1.51 | YL | 1.91 | AF | 1.88 | IY | 1.02 |
| VK | 1.11 | FY | 1.40 | AY | 2.00 | LF | 2.10 |
| YV | 2.76 | YE | 2.80 | GW | 1.48 | GY | 2.32 |
| GP | 2.65 | GF | 2.80 | GI | 3.08 | GM | 3.15 |
| GA | 3.30 | GL | 3.40 | GH | 3.49 | GR | 3.51 |
| GS | 3.58 | GV | 3.66 | GK | 3.73 | GQ | 3.73 |
| LF | 3.52 | IR | 2.84 | RL | 3.39 | KP | 1.71 |
| FL | 1.20 | VY | 1.25 | IL | 1.74 | VY | 1.55 |
| IY | 0.79 | AW | 1.27 | FY | 1.63 | VW | 0.52 |
| IW | 0.18 | LW | 1.37 | FY | 0.22 | KF | 0.89 |
| IF | 2.97 | VY | 1.76 | GQ | 3.75 | TP | 3.32 |
| TK | 3.21 | YH | 0.71 | KW | 1.03 | KY | 0.89 |
| KF | 1.45 | FY | 0.57 | VW | 1.03 | VY | 1.64 |
| IW | 1.09 | VY | 1.05 | IA | 2.18 | WL | 1.48 |
| IW | 0.67 | LW | 1.24 | RP | 1.96 | AP | 1.46 |
| KP | 1.34 | FY | 0.81 | GT | 3.76 | GE | 3.85 |
| GG | 3.86 | GD | 3.96 | VG | 3.04 | IG | 3.08 |
| RG | 3.08 | YG | 3.30 | AG | 3.40 | KG | 3.51 |
| FG | 3.57 | MG | 3.68 | WG | 3.77 | HG | 3.80 |
| EG | 3.87 | SG | 3.93 | LG | 3.94 | TG | 4.00 |
| QG | 4.00 | DG | 4.15 | PG | 3.94 | VW | 0.20 |
| IY | 0.30 | AW | 1.00 | RW | 1.20 | VY | 1.34 |
| VF | 1.72 | AY | 1.94 | IP | 2.11 | RP | 2.26 |
| AF | 2.28 | AP | 2.36 | RF | 2.36 | VP | 2.62 |
| AP | 2.43 | IR | 2.92 | VQ | 3.11 | IY | 0.43 |
| VW | 0.23 | MW | 0.58 | RW | 1.34 | KP | 1.48 |
Table 1. Dipeptides and their Log IC50 values for inhibition of Angiotensin converting enzyme [5].
Scaling is a necessary step for data processing for ANN. Linear scaling of the input parameters is done. Scaling is required to avoid numerical overflows because of very large or very small connection weights of the neural network.
The input data i.e. molecular descriptors are scaled between -2, 2 for dipeptides. The output i.e Log IC50 is scaled between 0.05, 0.95. The scaling is done using SciLAB and R. The formula used for the scaling the output is given by Equation (1).
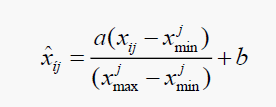 (1)
(1)
Where, a = 0.9 and b = 0.05.
Different scaling parameters are tested with different activation function of neural network and scale with best prediction is chosen.
Artificial Neural Network
Stuttgart Neural Network Simulator (SNNS) version 4.3 is used for modeling neural networks [6]. Different neural networks are prepared by varying the constraints provided during pruning which is based on the mean square error (MSE) and the sum of squared errors (SSE). Quick prop method is used for training the neural networks which is an implementation of backpropagation method.
training the neural network, the dataset was divided into 3 parts:
• 70% is used for the training set.
• 20% is used for the validation set.
• 10% is used for the testing set.
The outliers were detected by local outlier factor algorithm (LOF) [2] and by calculating the difference between given LogIC50 and predicted LogIC50, then taking the average of those errors and calculating the standard deviation. The data points with error more than 2 times standard deviation from average are considered as outlier. Neural network is re-trained after removing outliers for the training dataset. After training neural network, pruning of network is done using Brain- Surgeon algorithm and best neural network out of initial network and pruned networks based on Shibata parameter is used
Post-processing of data
Post training neural network, the values predicted by neural network are de-scaled to calculate average absolute error, mean square error (MSE), sum of squared errors (SSE) and the Shibata parameter for checking the performance of neural networks.
Results
Artificial neural network for dipeptides
Neural network of architectures 6-9-1, 6-8-12-1, 24-12-1 and 24-8-12-1 were trained with main dataset and after removing outliers for dipeptides.
Best resulting neural network was with 22-8-3-1 architecture with TanH function as activation for hidden layer neurons with scaling -2.5. Correlation obtained is tabulated in Table 2.
| Learning Parameter | No. of training cycles | MSE Validation (Scaled Error) |
|---|---|---|
| 0.001 | 30 | 0.2167 (0.0036) |
| 0.002 | 45 | 0.2204 (0.0036) |
| 0.003 | 45 | 0.3207 (0.0053) |
| 0.004 | 50 | 0.2446 (0.0041) |
| 0.005 | 50 | 0.2645 (0.0044) |
Table 2. Selection of learning parameter for 24-8-12-1.
Parity plot: A parity plot for the neural network has been shown in Figure. 1 and Figure. 2. The correlation obtained for the different set is tabulated in Table 3.
Figure 1: Plot of MSE versus training cycles for 24-8-12-1
Figure 2: Parity plot for 24-8- 12-1
| Name of set | Average absolute error | Mean square error | Sum of squared error |
|---|---|---|---|
| Training set | 0.2811 | 0.1677 | 19.7836 |
| Validation set | 0.3607 | 0.2168 | 7.3720 |
| Test set | 0.7558 | 0.9095 | 14.5078 |
Table 3. Correlation obtained for 24-8-12-1.
Efficacy of peptides using ANN
Removal of outliers: After training 24-8-12-1 neural network, some of the data points in the training set are removed as outliers to improve the performance of neural network.
Outlier removal resulted in dataset of 162 points, with 117 data points in training set, 32 data points in validation set and 13 data points in test set. The learning parameter is kept constant.
The parity plot for the 24-8-12-1 neural network trained with outliers removed from the training set is shown in Figure. 3. The correlation obtained for the different set is tabulated in Table 4.
Figure 3: Parity plot for 24-8-12-1 with outliers removed.
| Name of set | Average absolute error | Mean square error | Sum of squared error |
|---|---|---|---|
| Training set | 0.3056 | 0.1857 | 21.7277 |
| Validation set | 0.3502 | 0.1906 | 6.1001 |
| Test set | 0.6050 | 0.4351 | 5.6566 |
Table 4. Correlation obtained for 24-8-12-1 (with outliers removed).
Pruning: After removing outliers, the network is pruned. The steps involved is pruning are as follows: Figure. 4.
Figure 4: Flow chart for steps involved in pruning.
The parameters calculated on the basis of training set have been given in Table 5 and on the basis of test set has been given in Table 6.
| Net- work |
SSE Training |
Shibata Parameter |
Mean Square error of prediction |
Conservative Mean Square Error in prediction |
Generalized cross validation |
Alkalies Information criterion |
Schwarzs Bayesian Criterion |
|---|---|---|---|---|---|---|---|
| 24-8-12-1 | 21.7277 | 133.1518 | 0.6619 | -0.0450 | 0.0759 | 3.4446 | 4.0202 |
| (300) | |||||||
| 24-8-10-1 | 50.7610 | 243.3925 | 1.2571 | -0.1552 | 0.5387 | 2.9598 | 4.5676 |
| (222) | |||||||
| 24-8-8-1 | 16.3282 | 64.0568 | 0.3435 | -0.0726 | 0.6551 | 0.9538 | 3.1724 |
| (171) | |||||||
| 24-8-6-1 | 19.1793 | 63.7671 | 0.3545 | -0.1237 | 6.2160 | 0.5164 | 3.1043 |
| (136) | |||||||
| 24-8-3-1 | 23.7616 | 66.4160 | 0.3854 | -0.2555 | 19.3063 | 0.2008 | 3.0599 |
| (105) |
Table 5. Training set parameters for 24-8-12-1 and pruned networks.
| Net- work |
SSE Training |
Shibata Parameter |
Mean Square error of prediction |
Conservative Mean Square Error in prediction |
Generalized cross validation |
Akaikes Information criterion |
Schwarzs Bayesian Criterion |
|---|---|---|---|---|---|---|---|
| 24-8-12-1 | 5.6566 | 266.7304 | 10.4764 | 0.4351 | 0.0009 | 45.3217 | 4.8717 |
| (300) | |||||||
| 24-8-10-1 | 9.4060 | 330.6571 | 13.0791 | 0.7235 | 0.0028 | 33.8302 | 5.0791 |
| (222) | |||||||
| 24-8-8-1 | 5.2671 | 143.8323 | 5.7346 | 0.4052 | 0.0027 | 25.4042 | 4.2382 |
| (171) | |||||||
| 24-8-6-1 | 7.1478 | 156.7018 | 6.3019 | 0.5498 | 0.0061 | 20.3249 | 4.3145 |
| (136) | |||||||
| 24-8-3-1 | 6.6087 | 113.3646 | 4.6144 | 0.5084 | 0.0102 | 15.4773 | 3.9774 |
| (105) |
Table 6. Test set parameters for 24-8-12-1 and pruned networks.
Selection of pruned neural network: On the basis of Shibata parameter, 24-8-3-1 network was selected and used for further processes.
24-8-3-1 (105 connections): A parity plot for the 24-8-3-1 neural network trained is shown in Figure. 5. The correlation obtained from the different set is tabulated in Table 7.
Figure 5: Parity plot for 24-8-3-1.
| Name of set | Average absolute error | Mean square error | Sum of squared error |
|---|---|---|---|
| Training set | 0.3593 | 0.2031 | 23.7616 |
| Validation set | 0.4187 | 0.2527 | 8.0863 |
| Test set | 0.5760 | 0.5084 | 6.6087 |
Table 7. Correlation obtained for 24-8-3-1.
Discussion
Quantitative structure property relationship of dipeptides
24-8-3-1 neural network with outliers removed can be effectively used to predict the Log IC50 (logarithmic of 50% inhibition concentration) values of all dipeptides. The best obtained neural network of architecture 24-8-3-1 has average absolute errors 0.34, 0.42 and 0.58 for the training, validation and test set respectively.
Conclusion
We have made a model to predict the activity of dipeptides against ACE with errors is inacceptable range. Error can be reduced by eliminating the duplicate values of peptides, which can be done by taking the average of the multiple reported peptides. Other neural networks like recurrent neural network can be tried for training as they can hold the information for longer period. We can also try to use other neural network libraries like tensor flow, the oneo, etc. to reduce the training time and improve predictability.
References
- Mao S, Dan-Qun H, Hu M, et al. New descriptors of amino acids and its applications to peptide quantitative structure-activity relationship. Chinese Journal of Structural Chemistry. 2008 Jan 1;27(11):1375-83.
- Bourdeau P, Sommers E, Mark Richardson G, et al. 1990 Short-term toxicity tests for non-genotoxic effects.
- Hu Y, Murray W, Shan Y. Rlof: R parallel implementation of Local Outlier Factor (LOF). R package version. 2011;1.
- Zell A, Mamier G, Vogt M, et al. Stuttgart neural network simulator, Version 4.2. 1995 University of Stuttgart, Stuttgart, Germany.
- Tambe SS, Deshpande PB, Kulkarni BD, et al. Elements of artificial neural networks with selected applications in chemical engineering, and chemical and biological sciences. Simulation & Advanced Controls, Incorporated; 1996.
- Wu J, Aluko RE, Nakai S. Structural requirements of angiotensin I-converting enzyme inhibitory peptides: quantitative structure− activity relationship study of di-and tripeptides. Journal of Agricultural and Food Chemistry. 2006 Feb 8;54(3):732-38.