Current opinion
, Volume: 9( 8) DOI: 10.37532/2320â6756.2021.9(8).231Bipolar High-Gravity Topology Theory
- *Correspondence:
- Yigal Goldshtrom
Department of Science
Walden University, United States
E-mail: ygoldshtrom@gmail.com
Received: August 24, 2021; Accepted: September 8, 2021; Published: September 18, 2021
Citation: Yigal Goldshtrom, Bipolar High-Gravity Topology Theory. J Phys Astron. 2021;9(8):231.
Abstract
Bipolar high-gravity topology is a theory of the distribution of gravity Space-Time (ST) curvature around a spinning high-mass body. The theory stipulates that gravity converges in the poles as a result of momentum energy being dispensed outward during the body of mass rotation. As a result, the ST curvature in the poles is more acute, while gravity is lower in the direction of rotation. Thus, a stellar object moving North-South (N-S) passes through fluctuating gravity levels around the attractor. This fluctuation causes the formation of elliptical orbits. Observations of the S star group orbiting Sgr A* show that 14 out of 17 identified stars are orbiting elliptically N-S, and the other three orbit East-West (E-W) in a circular profile. Most stars in the Milky Way galactic center orbit E-W. The theory provides a non-Keplerian alternative mechanical explanation of elliptical orbits (N-S) based on this fluctuation of gravity. A similar pattern was identified in the OJ 287 binary BH system and the solar system among the 79 moons of Jupiter. It is suggested that the acute ST curvature at the poles increases gravity toward the midline axis between the poles, with a lateral radius similar to the Schwarzschild radii, which creates a longitudinal column extending outward bidirectionally. Observations of S2 encounters with Sgr A* at the epicenter in 2002 and 2018 showed flashes of bright light, which were longer in 2018. It has been suggested that S2 was passing at the time under the most extreme region of the bipolar high-gravity sector, the Schwarzschild’s vector, and some material fell into the black hole. Observations of OJ 287 showed periodical outbursts of flares at the time the secondary BH passed aphelion and perihelion. This theory can explain such astronomical events as the accretion disks at the poles and their inner working, active galactic nuclei energy outbursts through a narrow shaft from the poles, star oblateness, and flat galaxies, which provide habitable zones for stars and planets. The anomaly of Oumuamua’s trajectory is also discussed.
Keywords
Gravity; Black holes; Sagittarius A*; S stars; Accretion disk; AGN; Schwarzschild’s radius; Oblateness; Solar system; Jupiter; Oumuamua; Precession; OJ287
Introduction
One underlying assumption about gravity in Newtonian and relativity theories is that gravity is uniformly distributed in all spherical directions of an object with mass. In terms of relativity, it translates into having multidimensional curvatures of Space-Time (ST) around an object (FIG.1). The 3-D drawing is a good representation of the moment a star collapses on itself. However, the geometry of the ST curvature near a stable Black Hole (BH) and other massive objects that are not yet imploding has yet to be determined. One of the most common observations of high-energy events is isotropic energy transfer, both inward and outward, associated with high-mass stellar objects. An example is a supernova explosion that occurs after a white dwarf collapses on itself and explodes. Schady (2007) noted that, in the aftermath of an outer-layer explosion, most of the explosion energy is collimated into narrow jets [1] of light-emitting plasma, and isotropic Gamma Ray Outbursts (GRBs) symmetrically through the poles. This collimation process was suggested by Bondi and Hoyle [2], also known as the Bondi Radius [3], and have been observed, for example, in M87 [4]. Observations of galaxies and BHs reveal isotropic transfer of high-energy material inward and outward, a process that cannot be explained by a uniform gravity effect. In this article, it is proposed that the distribution of gravity in a fast-rotating object creates higher-gravity regions perpendicular to the direction of rotation, thus creating a bipolar high-gravity region in the North-South (N-S) rather than the East-West (E-W, rotational) direction.

Figure 1: ST curvature in 3D.
Supermassive Black Holes
Common features
In the past 30 years, theorists and observers have come to realize that Active Galactic Nuclei (AGNs) have common topologies and properties and only look different based on their orientation relative to the observer. These include exploding supernovae with diverse phenomena of galactic nuclei-quasars, Seyferts [5], radio galaxies, blazars, and of activities in galaxies like BL-Lac galaxies, Double-lobed radio galaxies [6], and others. The AGNs at the center of the activities have common features, such as the accretion disk, which is created from gas and materials that are falling in, torus, ejection of plasma and beams of electromagnetic radiation, or emission line (i.e., Seyferts and double-lobed radio galaxies) [7-9]. Supermassive Black Holes in the center of galaxies emit electromagnetic radiations or kinetic energies, in the form of bi-directional jets, for example, SMBH that cause bright light in the middle of their galaxies [10]. Antonucci (1994), proposed a unified model to explain the various observations of AGNs regardless of the type of emission (visual or nonvisual spectrum) to explain the differences in their classifications (FIG. 2). In this model, every AGN has a featureless continuum source and a Broad Line Region (BLR), both enclosed in an opaque torus. The torus is perpendicular to the associated radio structure axis [11]. This unified model describes a set of features observed among different types of AGN and is common among all AGNs. The BLR is a multicomponent line-emitting region with a disk-like structure, possibly an extension of the accretion disk itself [12] extending from one or both poles. The rotating disk of the material falling into the BH during the accretion period is included, as well as the jets of material bursting from the poles. The model also explains that different classifications of these objects are attributed to the different angles of view of observers. The unified model has not been without its critics as the ability to peer into SMBHs has increased [13]; however, the two basic topologies of SMBHs, the accretion process inward from a narrow path and the bidirectional jet emission from the poles (FIG.3), are common characteristics of SMBHs and specifically of AGNs.

Figure 2: A common illustration of Space-Time Curvature around a body with mass in 2D depicts the mass “nestles” into ST curvature.
Bipolar outflows
Other stars and galaxies exhibit bipolar emissions similar to those of AGNs. Frank reviewed bipolar outflows and wrote the following. “True bipolar outflows, which appear as two opposing lobes joined at the narrow waist (centered on the star), occur in both young and evolved systems” [14]. Activities occur through a narrow corridor leading to the core as material falls into the BH, causing an accretion disk to form. Some AGNs exhibit outbursts of energy and plasma, which are narrow lines or beams expelled from the core. Sometimes, the outbursts are symmetrically bidirectional from both poles [15]. Gull and Northover suggested that the internal release of energy in the nucleus of a galaxy leads to the formation of two streams moving in opposite directions along the axis of rotation. Blandford and Ress suggested that a Rayleigh-Taylor instability of the relativistic fluid causes a neck (column) to develop perpendicular to the rotation axis.
The Theoretical Model
Space-time curvature
In general relativity, ST is not “flat.” It is curved by the presence of bodies with mass proportionately to their mass. Mass, expressed as momentum, affects the ST curvature and creates the “gravity” effect we experience. ST can change around a body with mass when it interacts with other bodies in a dynamic interaction between matter and ST. One theory that was recently confirmed is Lense-Thirring frame dragging [16], which postulates that a spinning body with mass twists ST along its path. The momentum energy of a rotating body affects the ST around itself. One consequence of the rotational momentum is the establishment of poles perpendicular to the angular momentum vector.
The general view of the ST curvature depicts the body with mass “nestling” into the ST curvature (FIG. 2).
This is an asymmetric gravity effect, and it may not capture the true dynamics of the topology of the ST curvature. Schwarzschild proposed that the ST topology narrows down into the BH until in the middle of a body of mass form an event horizon close to the equator. Therefore, asymmetrical projected ST curvature should meet at the event horizon from both sides, creating the poles of the body north to south. A third intermediate region of the ST curvature develops east to west in the direction of rotation (FIG. 3). The intermediate low-gravity zone can also be called the “habitable zone” because it makes the formation of galaxies possible. The poles and bipolar high-gravity zones are related to the rotational momentum and its oblateness.

Figure 3: Schwarzschild proposed an event horizon in the middle of a body with a mass close to the equator. Therefore, asymmetrical projected ST curvature should meet at the event horizon from both sides, creating the poles of the body north to south. The third region of ST curvature develops east to west in the direction of rotation. The third region has a lower gravity effect and can become a habitable zone for other stellar objects orbiting east to west.
Star rotation and oblateness
Oblateness is a consequence of the momentum of rotation. It is a topology of rotating stars, where their equatorial radius is larger than their polar radius. Stars with very high rotation, such as Achernar [17] and Altair [18], have been measured to have an equatorial radius of 1.5 times their polar radius, which is considered a critical rotation rate. The rotating body is subjected to centrifugal forces that can cause oblateness, but rotation also creates angular momentum (L), which contrasts the outward centrifugal forces.
Wang (2016) tested the hypothesis that oblateness is caused by centrifugal forces using the evolution stellar en rotation (ESTER) models to simulate fast-rotating stars by calculating the kinetic energy contained in the differential rotation (shearing) and the contribution to oblateness [19,20]. It was found that oblateness contributes approximately 61% of the fractional kinetic energy contained in the differential rotation [21]. It was concluded that “this level of differential rotation is not enough to have a significant impact on the oblateness of the star.” It was proposed that a differential gravity effect between the poles and the equator contributes to the oblateness. The process fuels by an accretion that uses gravity to release angular momentum energy by viscosity and Magneto Hydro Dynamic (MHD) energies. The angular momentum is then dispensed outward from the rotating accretion disk perpendicular to its rotation, causing the outer envelope to rotate [22]. The rotation generates momentum-energy flux that diverges from the direction of rotation (equator) toward the poles, causing convergence of the energy flux at the poles, which in turn increases the ST curvature at the poles, resulting in a differential gravity effect between the poles and the equator regions (FIG. 4). The conservation of momentum energy is maintained because the sum of the momentum energy of the entire mass at rest is preserved, although it is a spread difference between the equator and the poles of a rotating body. The high gravity effect at the poles can be attributed to the polar origin of isotropic energy in the form of MHD jets, GRBs in supernovae explosions, and radio bursts from the BHs of galaxies.

Figure 4: ST momentum-energy flux through tensor fields cause the energy to diverge in the E-W direction of rotation and the flux to converge at the poles. This increases the curvature of ST and the effect of gravity in the N-S axis. The acute ST curvature at the poles (in red) creates pressure inward and contributes to the oblateness of the body at the equator.
Gravity fluctuations-differential Gravity effect between the poles and the equator regions
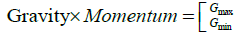
Where,
Gmax is the maximum gravity at the poles for rotating body, perpendicular axis to the direction of rotation-N-S
Gmin is the direction of rotation= E-W
such that if,
then ω has an inverse relationship to Mass
Note: it is also recognized that a body of mass could have more than two poles.
In the bipolar high-gravity theory, the ST curvature at the poles (north to south) is more acute than that at the E-W, leading to a differential gravity effect, which is higher at the poles. The intermediate region experiences lower gravity and, as a result, can create a habitable zone for other stellar orbiting bodies E-W. The habitable zone can be recognized inside “flat” or disk-shaped galaxies, such as the Milky Way (MW), and it explains how binary stars do not annihilate each other, and why high-mass stellar bodies feed through their poles. In addition to oblateness in rotating bodies, it can also explain and predict elliptical orbits.
A case in point is BH Sagittarius A*. Studies of Sgr A* from the past 25 years tracked the paths of a group of stars orbiting an empty location in the middle of our galaxy where Sgr A* is suspected. In recent years, new telescopes have become available, and data regarding the movement of these stars, known as “S stars,” are more accurate. Recent studies tracked the path of several stars passing through the empty section in Keplerian eccentric elliptical orbits around Sgr A*. The bipolar high-gravity theory proposes an alternative explanation for elliptical orbits.
Keplerian elliptical orbits
Elliptical orbits fascinated early astronomers, such as Kepler (1609) and Newton, who described three factors that determine the orbit of a planet in his book Philosophiæ Naturalis Principia Mathematica (1687). The acceleration of the planet moves toward the star, and the force acting on a planet is the product of its mass and acceleration, with an inverse relation to the distance between the objects. None of these laws explains elliptical orbits. Kepler was puzzled over elliptical orbits, and he sought to solve this by defining three laws. The first law states: "The orbit of every planet is an ellipse with the sun at a focus." From this law, one can understand that circular orbits are just one case of elliptical orbits. However, considering orbit mechanics, given a system of an orbiting planet around a star, a circular orbit is the most efficient/economical orbit in terms of energy investment. The economical factor can predict that a new planet captured by a star with an elliptical initial orbit will become circular over time. Mathis, in a selfpublished article, stipulated that it is impossible from a physics perspective to maintain an elliptical orbit without changes to one of the three Newtonian parameters [23]. Using the standard Keplerian orbit with one attractor and two foci, Mathis argued that, in a Keplerian model, the following is true. “The tangential velocities due to innate motion are equal, meaning that the velocity tangent to the ellipse is the same in both foci. However, the accelerations are vastly different due to local gravity. And yet the ellipse shows the same curvature at both foci. The ellipse is a symmetrical shape, just like the circle.” The curves of the orbiting object at each focus differ from one another because of velocity and angular momentum differences. As a result, the orbit at the far end of the star (aphelion) should be wider. The velocity and angular momentum of an orbiting mass approaching an attractor is different from the velocity and angular momentum of the orbiting mass at the aphelion as the distance from the attractor increases. When looking at an orbiting body at the aphelion, the most intriguing question is why it falls back toward the attractor from a farther distance after escaping a close-by passage.
Accretion process and keplerian orbital motion
MHD energies in the accretion disk transfer angular momentum by viscosity within the disk, creating a Keplerian movement of energy and producing an outward transport of angular momentum, which is a self-regulated process[24]. The transfer of angular momentum outward results in rapid decay of the steep rotation law, producing a flatter rotation law and differential rotation [25]. Studies of accretion disks around massive young stellar objects suggested infalling Keplerian rotation disk profiles [26,27].
Multiple studies of the galactic center (GC) of the MW have been conducted to measure the mass of Sgr A* by measuring the orbit of groups of stars in the nuclear star clusters (NSCs). These groups include young stars like the B stars, older stars like the S stars, the stars closest to the BH, and O-type and Wolf-Rayet stars. The motions of the S-star group are in multiple directions, E-W and N-S, while the farther cluster of stars in the NSC has a flat motion pattern parallel to the galactic rotation. Schodel studied the motion of more than 6000 stars in the central parsec of the MW and found that the observed velocity dispersion profile is essentially Keplerian in the inner 0.1 pc, while the velocity dispersion is nearly constant at r>0.5 pc [28].
Elliptical non-keplerian orbits
Observations of elliptical orbits have raised some questions regarding the Keplerian model. Some studies have suggested that when an object orbits a BH at the periastron, a shift in the tangent velocity can occur because of an uneven or bulging distribution of mass at the BH. This could increase the gravitational pull when the distance to the pericenter shortens momentarily as the orbiting object passes at the pericenter, which may cause a shift in the tangent of the orbiting object [29]. This idea explores the consequence of distance at the perihelion as the engine of elliptical orbit without explaining the physics at the far end of the aphelion.
The bipolar high-gravity theory proposes that gravity convergence is the engine that propels an object toward elliptical orbits, where the mechanism lies within the differential gravity effect (ST curvature) at both poles of a body with mass.
FIG. 5 depicts a system in which a high-mass attractor with bipolar gravity topology creates multiple lateral gravity regions along the path of an orbiting stellar object on an N-S axis. The red lines show the ST curvature boundaries that reflect the high-gravity regions in the north and south axes and relatively low gravity laterally on the E-W axis. The proposed topology can shape the orbit of a stellar object at four specific points. Point P1 is where the object travels into the high-gravity zone near the epicenter, thus changing its orbital tangent. P2 is the point of gravity change after passing the epicenter at high speed traveling toward the lowgravity zone, P3 is the high-gravity re-entry point where the object travels into the high-gravity zone toward the second pole, and P4 is the point where the turning object “jackknifes” back toward the epicenter. P4 is located near the vertical line, extending from the poles of the attractor. This line is a vertical midpoint in the high-gravity zones north and south. The line continues through the poles crossing the Schwarzschild event horizon. It is suggested that the line represents the most extreme gravity vector within the high-gravity zone, where its lateral radius corresponds to the Schwarzschild radius. Thus, the vector (point P4) extends throughout the poles in both directions. It is proposed that the proximity of a stellar object to P4 while passing at the aphelion determines the tangent velocity and, therefore, its angular momentum on the way back toward the perihelion. However, the tangent velocity at the aphelion is smaller than that at the perihelion. As a result, it makes a wider turn at the aphelion, unlike in the Keplerian model, and the result is a skewed elliptical path on its way back toward the perihelion. The wider turn pushes the return orbit outside the Keplerian path, and the pericenter is not at the symmetrical axis of the ellipse North-South.

Figure 5: Bipolar high-gravity topology theory proposes that the orbit of a stellar object around a high-mass attractor in an N-S direction is elliptical. However, this ellipse is different from the Keplerian ellipse (black) because it is not symmetrical but rather skewed at the aphelion (red ellipse) in the direction of the orbit (b). After all, the tangent velocities at both foci are different. As result, the attractor is not at the center of the ellipse at perihelion (a). A stellar object moving in the E-W direction has a profile of a circular orbit because it moves through a single gravity system.
Some support for the bipolar high-gravity model can be seen in the images of the universe. Examples include the Crab Pulsar (PSR B0531+21), Eta Carinae (heic1912), Centaurus A galaxy, M82 Galaxy, Southern Crab Nebula, radio luminosity of Cygnus A, and Fermi Bubbles, two enormous orbs of gas and cosmic rays that tower over the MW. One can also find support for this theory in the data captured while observing Sagittarius A*, the BH in the middle of the MW galaxy.
Analyses of observations
The stars that orbit Sagittarius A*
During the past 25 years, astronomers have taken images of the center of the MW, where an SMBH by the name Sagittarius A* is suspected. More than 100 stars have been discovered in this region, and data have been collected from multiple telescopes using different methods, including radio and (near) infrared spectrometry. Images taken from the region are dotted with stars passing in the background, so identifying a star that orbits Sgr A* requires assumptions and computational models to filter out other stars seen in the background but not orbiting Sgr A*. The group of stars identified as orbiting Sgr A* is called “S stars” and are S0 references of Sgr A*. The identified S stars are assigned a unique number. A recent study of the data accumulated over 25 years of observations identified the path of only 17 S stars from the image speckles, and only one, S2, had a complete orbit One interesting datum visible in that drawing is that 14 out of the 17 stars are seen orbiting elliptically on an N-S axis, as predicted by the bipolar high-gravity topology theory. Star S13 has a circular orbit, and S38 and S21 seem to orbit E-W. A drawing of the Bipolar ST curvature is superimposed on the original diagram from Gillessen to illustrate the bipolar high gravity topology model [30].
Multiple studies have been dedicated to calculating and predicting the orbit path of stars orbiting Sgr A* by analyzing the paths of S2 and S38. For example, data collected from 1995-2014 were used [31,32]. Star S2 has an elliptical orbit in the N-S around Sgr A* with an orbit period estimated to be approximately 16.2 years [32,33]. Parsa, et al. reported that S2 appeared in 33 images from 2002 to 2015, while the path of S38 was charted in 2004 with 29 astrometric measurements collected from 2004 to 2015. A third star in the analysis is S0-102/S55, and it is located in a crowded region close to Sgr A*. The name “S102/S55” refers to a union of two sets of observations that are combined to create one identified star. Some observers commented that the speckles look fainter on the images [34], and therefore are not detectable in every image. It has a period of only approximately 11.5 years, but only 25 measurements were recorded from 2004 to 2015. The path of S38 is perpendicular to S2 and S0-102/S55 (FIG. 6); therefore, it has been analyzed in several studies. The orbit of S38 has been simulated to have an elliptical orbit with foci extending E-W (FIG. 7), which is at odds with the prediction by the bipolar high-gravity topology model for E-W orbit. The orbits of S2 and S38 are discussed in more detail in the following.

Figure 6: Astrometric data for 17 stars used for the multi-star fit, shown together with the best-fitting orbits from the multistar fit (solid lines). Source: Gillessen, 2017. A drawing of Bipolar ST Curvature superimposed on the original work for illustration of the Bipolar High Gravity Topology theory.

Figure 7: The orbits of S2, S38, and S0-102/S55. Best relativistic fit orbit of the candidate stars. The astrometric data in the reference coordinate system are represented by points with error bars (smaller than the diameter of the point in most cases). The relativistic orbits of the fits are shown by solid lines. Extrapolations before and after the region for which we have data are shown as dashed lines [31].
The orbit of S2
S2 is the most studied star among the S stars orbiting Sgr A*, mainly because it is the brightest of the S stars and has a short orbital cycle of 16.5 years [35,36]. In 2018, Sgr A* was closely encountered with some unexpected results that were captured by major telescopes tuned into the events. S2 was studied twice while passing Sgr A* at the pericenter in 2002 and 2018 (FIG. 8). It was observed that the pericenter was off center relative to the orbit of S2. This issue has been observed in several studies. Gillessen, et al. noted that “the positions of S2 are dragged for most of the data to the northeast; they are not biased toward Sgr A*” (FIG. 9). Chu, et al. investigated the possibility that S2 has a binary companion star to explain the bias in the orbit of S2. However, it was concluded that there was no evidence for a companion star of S2 [37].

Figure 8: Summary of the observational results of monitoring the S2-Sgr A* orbit from 1992 to 2018. Left: The projected orbit of the star S2 on the sky (J2000) relative to the position of the compact radio source Sgr A*. Triangles and circles denote the position measurements with SHARP at the NTT and NACO at the VLT. All data points are corrected for the best-fit zeropoint (x0; y0) and drifts (?x0; ?y0) of the coordinate system relative to Sgr A*. Green squares mark the GRAVITY measurements.

Figure 9: The motion of the star S2 as it passes close to Sgr A* at pericentre. It was compiled from observations with the GRAVITY instrument in the VLT interferometer. At this point the star was travelling at nearly 3% of the speed of light and its shift in position can be seen from night to night. The sizes of the star and the black hole are not to scale. The Red markings were added by this author to illustrate the effect of BiPolar High Gravity Topology on the motion of S2.
Astronomers had a chance to observe S2 passing Sgr* at the pericenter for the second time in 2018. The passing was captured by multiple telescopes [38,39]. A summary of the observations of the orbit of S2 from 1992 to 2018 confirmed that S2 leans to the northeast as it travels south toward the pericenter. An analysis of the path of S2 around Sgr A* is shown in FIG. 9. S2 arrives at Sgr A* from the northeast (right side). This section shows that S2 moves closer toward the pericenter from the east, changing its orbital tangent around point P1. This marks a sharp increase in velocity toward Sgr A* as the gravity in that area increases. S2 continues to orbit the SMBH, and, at point P2, it leaves the high-gravity zone, an event that is marked by a decrease in its orbital tangent while the velocity remains the same. The change in the orbital tangent at point P2 decreases the angular momentum, enabling S2 to fly away north from its close encounter with the BH. While this is a conjecture rather than a proof, the bipolar high-gravity topology model can explain two repeating incidents that occurred during the passage of S2 by Sgr A*.
The pericentre passage of S2 in 2002During the 2002 passage of S2 at the pericentre S2 exhibited a 3.8 μm excess in its brightness [40]. Gillessen later reported that the data show that S2 became bright and added, “the photometry of the star near pericenter-passage is puzzling”. This triggered discussions for possible explanations for the phenomenon including flares from Sgr A* [41], internal tidal heating within S2 [42] dust, and confusion with another star, which Gillessen, et al. suggested as the most likely cause. In 2018, a second pericenter passage of S2 was observed by multiple telescopes, including the Keck 2 observatory near-infrared camera, which observed the pericenter for four days. On May 13, 2019, the telescope captured a bright light appearing for a few hours between S2 and the location of the SMBH as it passed by its closest point (FIG. 10). The researchers wrote the following. “Sgr A*'s flux level changed by a factor of 75 within 2 hours. The maximum observed fluxes occurred during the beginning of the observations, suggesting that Sgr A* was likely even brighter earlier in the night.” This is the first time in human history that the location of Sgr A* has been revealed. At the time of the pericenter approach in 2018, S2 was within 100-120 AU ≈1400 Schwarzschild radii from Sgr A*. Two other possibilities besides S2 were discussed-two dusty objects (G1 and G2) that have shown signs of tidal interaction with the BH in past decades [43]. However, G2 has been postpericentre since 2015 [44]. S2 was the closest S star at the pericenter in 2018, and, in 2002, pericenter flyby S2 also showed increased brightness during the passage. Therefore, S2 is the most likely source of the glow in both encounters. Considering S2 as the source, the bipolar high-gravity topology model can explain these repeating events.

Figure 10: A series of K’ images taken on 2019 May 13 centered on Sgr A* showing the large variations in brightness throughout the night. The first image is the brightest measurement ever made of Sgr A* in the near-infrared. Also labeled are nearby stars S0-2 (K’ = 14 mags) and S0-17 (K’=16 mag) for comparison.
S2 at pericentre
GRAVITY analysis of S2 passing by Sgr A* during 2018 (FIG. 10) was performed with a daily marking of the observations. To understand the effect of bipolar gravity convergence better, a bipolar ST curvature model was imposed on the original image (in red). In addition, the red dashed vertical line was added as the vertical position of the Schwarzschild radius, which represents the column or the accretion disk shaft erected perpendicular to the direction of spin where gravity is extreme. The analysis begins with S2 passing toward the pericenter as of March 31, 2018, after it passed point P1, when S2 was already experiencing a higher gravity pull from the bipolar ST curvature. By the middle of May, S2 passed through the event horizon vertical position line, marked as P4, experiencing the extreme gravity effect. The event horizon, suggested by Schwarzschild, is a small circle in the middle of an object with mass, where gravity is most extreme (ST curvature is most acute). Under the bipolar high-gravity topology model, one can imagine a column within the ST leading out from the event horizon sphere in opposite directions north and south through the body of mass and continuing outward into space. The shaft has a radius similar to the Schwarzschild radius, and the effective distance of the extreme gravity shaft/column can stretch out light years away from an SMBH. Around the middle of May 2018, S2 passed through the southern column on its way west. The Schwarzschild radius given the mass of Sgr A* is estimated to be 1.5 m × 1010 m, while the velocity of S2 at that moment is estimated to be ≈7650 km/S at the pericenter. Therefore, it should have taken approximately 52 min for S2 to pass through the full diameter of the ST curvature acute region, a vector (column) that extends from the event horizon, or less time if it passed through a smaller sector of that column. As S2 passed by or through the region under the event horizon, some material dislodged off the star and started to fall toward the SMBH. At that time, S2 was at a distance of around 100 AU from the BH at pericentre. The extreme gravity should have increased the angular momentum of S2 as it lost some material, which could result in S2 being captured by the SMBH into a circular orbit. However, as S2 continued to travel west, it crossed out of the high-gravity region completely, at point P2. As a result, its tangent velocity relaxed, enabling it to escape being captured traveling while turning north. At some point, S2 will encounter the northern side of the bipolar high-gravity region of Sgr A* at P3 and will slow down. At point P4, it will make another jackknife south at a wider orbital tangent. The bipolar high-gravity model proposes that the passage of S2 under the event horizon region is the cause for the bright light events at the pericenter in 2002 and 2018. The time-lapse images from the Keck observatory from that event in 2018 (FIG. 10) show S2 as it separated from the bright lights, marked as Sgr A*, traveling west for 4 h or more as the brightness is dimming. This is different from 2002, in which S2 itself became bright during the passage. However, from the perspective of the proposed bipolar high-gravity topology theory, the difference between the 2002 and 2018 events is an issue of magnitude brought about by the position of S2. It is the 24-million-kilometer-wide column of extreme gravity. In 2018, S2 passed within the region of the event horizon column, while, in 2002, S2 passed at a distance farther from its center. In 2002, the proximity to the event horizon column only caused the star to heat up significantly, but, in 2018, it caused the star to lose some material. The Keck images provide some support to the theory that, when S2 passed under the event horizon column, some material lodged from it and fell toward the SMBH. The material fell toward the accretion disk and began to heat up and was consumed 4 h or more after S2 had already passed the extreme-gravity region. However, the beginning of the process has been missed, as the Keck observers noted, where one might have seen that the material started burning when S2 was closer to Sgr A* traveling west. If a significant amount of material was lodged off S2, it would have altered the velocity and orbit of S2. Observing the impact, if any, on S2’s could happen in future years.
Analyzing S38’s orbit
The bipolar high-gravity topology theory predicts that an object orbiting perpendicular to the poles will have a circular orbit because gravity does not fluctuate significantly in the E-W axis. S38 is believed to have a Keplerian path as it travels E-W, but, when comparing S2 and S102/55 (FIG. 11), one can see that the path of S38 is the least mapped among the three. A study from 2016 collected all available astrometric data from 1995 to 2013 searching for speckle images using speckle holography to track undetected speckles from 1995 to 2005 of the orbit of S38. The results are shown in FIG. 12, containing 12 newly identified speckles from earlier years marked along the predicted orbit of S38 of 19 years. The authors of that report stated that “the motion of S0-38 alone is well fit by a Keplerian orbital model.” Tracking star movements from thousands of speckle images is as much an art as it is a science. It involves theoretical assumptions that influenced the search and mathematical calculations. That report listed several parameters used in the search for speckles of S38 from 1995 to 2005, including a set of six Keplerian orbital parameters. Other parameters affecting the search include velocity, which was set to 400 km/s, and the spatial search parameter that limits the search between points to a span of 90° off the target, which is the location of Sgr A*. These search limits affect the results. One way to affirm past findings is to make predictions. In the case of S38 with a Keplerian orbit of 19 years, one should expect that some of the 12 new speckles from 1995 (FIG. 13) would be reconfirmed on images from 2015 to 2020. (FIG. 14) shows the Prasa diagram with a time-series prediction of the location of S38 in 2020 based on the Keplerian model suggested by Boehle et al. (2016). The first assumption was of the location of S38 in 2004. Parsa suggested that the two close points above the pericenter (FIG. 13) represent S38 in 2002. In 2002, S2 was at the pericenter, so one can extrapolate, based on Parsa, where S2 and S38 were in 2004. From that, one can find S38 in 2014/2015 after 10 years, which also corresponds to the new speckle found by Boehle in 1995 (FIG. 14). If one accepts a Keplerian orbit of 19 years for S38, then, in 2020, S38 should have been very close to Sgr A* on its way to pass over the SMBH from its north pole (FIG. 13). In addition, because S2 just passed Sgr A* from the south in 2018, both S2 and S38 should have been very close to each other in 2020 (S38 is marked by a crossed circle), both traveling north after S2 just passed the pericenter with Sgr A*. The passage of S2 in 2018 at the pericenter was tracked by multiple telescopes, so it was expected that this close encounter by S2 and S38 would be identified.

Figure 11: The orbits of S2, S38, S0-102/S55. The best relativistic fit orbit of the candidate stars. The astrometric data in the reference coordinate system are represented by points with error bars (smaller than the diameter of the point in most cases). The relativistic orbits of the fits are shown by solid lines. Extrapolations before and after the region for which we have data are shown as dashed lines. The data for S2 is from 2002 to 2015, the S55/S0-102 data is from 2004 to 2015, the S38 data is from 2004 to 2015.

Figure 12: The best-fit orbit for S0-2 (blue line) and S0-38 (red line) on the plane of the sky. These model orbit lines show the positions of these stars from 1995 to 2014. Both stars orbit clockwise on the plane of the sky. Closed circles indicate astrometric detections that were used in the orbital fits. Open circles indicate points that were not used in the fits because these astrometric detections are biased due to the proximity of other known sources on the plane of the sky. For S0-38, this consists of the two epochs of May and June 2002 in which the position of S0-38 shows a bias because it is blended with S0- 104; in all other confusion epochs Starfinder Force 1 can only recover a position close to the neighboring source and S0-38 is undetected. Note in particular the paucity of detections around the point of closest approach at the bottom of S0-2’s orbit. The implication of the absence of useable detections in this part of S0-2’s orbit is that S0-2 constrains the horizontal position of Sgr A* in our reference frame (x0) better than its vertical position (y0). S0-38’s orbit on the plane of the sky is perpendicular to that of S0-2, so it can provide additional constraints on y0.

Figure 13: A time-series analysis of the data of both studies charting the path of S38 close to S2 at pericentre in 2020. That event should have been anticipated already in 2018 as multiple telescopes were looking at S2 passing Sgr A* at pericentre.

Figure 14: Augmented time-series path of S38 based on 26-year circular orbit indicating that S38 is approximately six years away from the pericenter and that some speckles attributed to S122/55 could be of S38.
An alternative time-series analysis based on a circular orbit profile is shown in FIG. 14, where a 26-year orbit of S38 would place S38 six years away from the pericenter. This proposed path also raises the possibility that some speckles attributed to S122/55 are those of S38.
The Case of OJ 287
OJ 287 is bright blazar (AGN) located in the constellation of Cancer. Observations of this area started in 1886 continuously collecting repeated periods of high-brightness flares. Analysis shows a repeating pattern of flares that occur in cycles of 12.7 years [45] and another flare cycle of 60 years that are attributed to orbital precession [46]. OJ 287 is a massive Binary BH system where a secondary BH is in a quasi-Keplerian orbit of a given precession rate around the primary BH [47]. Dey, et al.[48] studied the collection of observations of the optical outbursts of OJ 287 and created a simulation of the elliptical precession orbits of the secondary BH marking the outbursts at the time and orbital location within the 12.7 years orbital cycles (FIG. 15). The graph shows that the outbursts occur along the accretion line bi-directional at the perihelion and at the aphelion, which corresponds with Y=0 on their graph. Among the outbursts at aphelion, the flares of 2005.743 were predicted in 1997 [49], the flares of 2015.868 were predicted in 2010 and observed in 2017. The 2015 flares emit energies in both optical and X-ray spectrum and travelled from the secondary BH 15,000 AU toward the primary BH. The researchers noted that it “appears that the perturbations are transmitted via the corona to the inner parts of the accretion disk” of the primary BH. The observations of OJ 287 showed also two outbursts that occurred at perihelion as the secondary BH pass the pericentre in 2007 and 2019 FIG. 16. The 2019 observation was performed using the Spitzer space telescope using an Infrared camera [50]. The observers reported that the outbursts were similar to the 2007 observation. The secondary BH passed pericentre at a distance of about 150 AU and then flares have been recorded over 5 weeks. The first group of 5 flares was observed over a span of 12 hours, and the rest of the flares were observed one or two flares per week.

Figure 15: The simulated orbit of a secondary BH in OJ287 BBH in the 2005–2033 Window around a primary BH. The graph shows the primary BH with its projected accretion disk along the y=0 plane. The locations of the secondary BH at the time of different outburst epochs are marked by arrow symbols [48].

Figure 16: The simulation of the BBH OJ287 system where the secondary BH orbits the Primary BH at Perihelion. The Bipolar High Gravity Topology model (in red) is overlaid on the graph showing the High and Low Gravity regions. The red dashed line represents the Schwarzschild “vector”, a vertical line in the middle of ST curvature extending bi-directionally from the pols. The observations of outbursts occurred around the Schwarzschild “vector” at aphelion and perihelion. The direction arrows of the orbits were added for clarity.
FIG. 17 is based on the simulation of FIG. 16 with the bipolar high-gravity diagram overlaid the graph (in red) to show the effect of gravity fluctuations on the orbit around an attractor N-S. The dashed line represents the Schwarzschild “vector”, a vertical line in the middle of ST curvature extending bi-directionally from the pols. The observations of outbursts occurred in proximity to the Schwarzschild “vector” at both aphelion and perihelion. The researchers in the 2015 observation noted that the outbursts were directed toward the accretion disk from a distance of 15,000 AU, which is in line with our definition of the Schwarzschild “vector” as the highest gravity region in the midline of the ST curvature. A second important observation is that the outbursts occurred from a distance of 10,000 AU to 15,000 AU at aphelion but no burst occurred from a closer distance until the secondary BH passed the pericentre at a distance of about 150 AU. At pericentre, flares from the secondary BH were observed in 2007 and 2019 after the pericentre passage. In 2019 multiple outbursts have been recorded during 12 hours, and then a few more were observed for the next 5 weeks. There was a sharp increase in gravity as the BH passed the pericentre at only 150 AU. This was similar to the sharp increase at aphelion, farther away from the primary BH. The passage under the narrow extreme gravity region triggered the outbursts for 12 hours and then subside significantly as the BH continue orbiting the primary BH in close proximity. The bipolar high-gravity theory explains these outbursts as the result of the secondary BH crossing through the midline of the ST curvature. The midline of the ST curvature is a region of extreme gravity the size of the Schwarzschild’s radii, a vector that crosses through the primary BH and extends from both polar regions. The observations of OJ 287 demonstrate that the Schwarzschild “vector” can be powered from a distance of 15,000AU and that gravity fluctuate around rotating objects with mass, high in regions of the poles and low around the horizon region in the direction of rotation.

Figure 17: Jupiter’s 79 moons are divided into groups. Two small groups together comprising eight moons known as the “Galileo” and the “inner” groups are orbiting E-W with low inclination and eccentricity. The rest, known as the “irregular” and “retrograde” groups, have high inclination (greater 10° inclination with respect to Jupiter's equatorial plane) and high eccentricity (elliptical orbit). They also travel farther from Jupiter above the poles. These groups include prograde and retrograde moons. A retrograde inclination orbit is marked by subtracting 180° from the inclination relative to the equator. For this diagram, the retrograde inclination degrees were reproduced by subtracting 180° to calculate the relative inclination from the equator of Jupiter irrespective of their orbit direction in comparison with the prograde moons [51].
Eccentrically orbits in the solar system
The principles of bipolar high-gravity topology theory can be demonstrated in other planetary systems, not just massive BH systems. Our planetary system is a good example of planets revolving around the Sun and moons orbiting planets. The proposed bipolar high-gravity topology theory stipulates that a stellar object orbiting an attractor while extending its orbit above or below its poles has an elliptical orbit. Jupiter, with 79 moons, can showcase this prediction. Among the 79 moons, eight of the moons of Jupiter orbit E-W. These include the four inner moons Metis, Adrastea, Amalthea, and Thebe and the four in the Galileo group Io, Europa, Ganymede, and Callisto. The other 71 moons of Jupiter are considered irregular satellites, some of them have retrograde orbits. These moons are farther from Jupiter with a high inclination with respect to the equatorial plane and eccentricities of Jupiter (FIG. 16). The combination of distance and inclination takes these moons above and below the poles of Jupiter, where they encounter the bipolar high-gravity regions.
The case of oumuamua
Oumuamua (A/2017 U1) was first spotted on October 19, 2017, by the Pan-STARRS 1 telescope in Hawaii. The object travelled NS to the Sun and its hyperbolic path around the Sun was calculated [51]. The actual trajectory and speed were followed using the Hubble telescope. In 2018, the observers concluded that there were discrepancies between the expected and observed trajectory and spee. The angle of the hyperbolic exit path after it passed the Sun at the perihelion (FIG.18) was less acute than originally calculated based on the entry speed, the mass of the Sun, and the distance between objects.

Figure 18: A diagram illustrating the parabolic trajectory of Oumuamua, as well as the comparison of its expected and actual trajectory. [51]
The escape speed of the object was also higher than expected based on the same parameters. Both measures point to the fact that, on exit, the gravity of the Sun became lower than expected. FIG. 19 explains the phenomenon based on the theory that gravity is higher in the northeast and lower E-W. When Oumuamua passed the Sun at the perihelion, turning east, the gravity of the Sun subsided, reducing the angular momentum and the exit velocity of the object leaving the Sun. The calculated estimation differential is the result of the differential gravity effect between the poles and the equator regions.

Figure 19: The bipolar gravity scheme was imposed on the original impression. Oumuamua approached the Sun from the north (high gravity) and then turned toward the east (low gravity) region. That explains both how it maintained its higher speed and its trajectory angle flattened toward the horizon.
Discussion
It has been accepted that high-mass stellar objects share common behaviours and features. In this analysis, it was proposed that some of these common behaviours and features point to the dynamics of the ST topology. The bipolar high-gravity topology theory proposes that rotational momentum creates a flux of momentum energy in the direction of rotation that converges in the poles perpendicular to the momentum vector, thus creating bipolar high-gravity (acute ST curvature) regions at the poles and lower-gravity forces in direction of rotation (E-W). It was also proposed that the shape of the orbit of a stellar object around an attractor is determined by its relative angle over the horizon (E-W). If the orbit of an object extends above or below the poles (N-S axis) of the attractor, the orbit becomes elliptical. The reason for the elliptical orbit is that the orbiting stellar object passes through regions with varying degrees of gravity travelling around and between the north and south poles, the high-gravity regions, and therefore experiences different magnitudes of orbital tangents at the turns between the foci. This results in a wider turn at the aphelion and a northeast-biased elliptical orbit. An analysis of the Sgr A* region and the set of orbiting S stars confirmed that most of them orbit in a N–S axis elliptically. In addition, the orbit of S2 matches the prediction that the orbit will be skewed northeast at the aphelion, in the direction of orbit. As a result, the pericenter (Sgr A*) is skewed southwest of the symmetric axis. The analysis of the close encounter of S2 at the pericenter in 2002 and 2018 suggests another aspect of bipolar high-gravity topology, where the center axis of the poles exhibits the highest level of gravity. This is the center of the vertical axis of the accretion disk, and it is also the location of the vertical shaft where high-energy bursts have been observed. The vertical column is aligned with the Schwarzschild radius and create a bi-directional high-gravity vector. When S2 was observed passing at the pericenter, glowing energy was captured by the observers. The bipolar high-gravity model suggests that S2 passed the pericenter under the Schwarzschild’s vector and shed some material that fell toward the BH at a high speed. The amount of energy produced in 2018 was greater than that in 2002 in terms of intensity and duration, suggesting that the amount of S2 lost in 2018 was much greater. This suggests that S2 was in the outer region of the 12 Million Km radius of the Schwarzschild’s vector in 2002 relative to the path of 2018 and, thus, was less exposed to the extreme gravity effect. It is therefore theorized that S2 may have lost mass that could alter its path around Sgr A* and its orbital duration. Analysis of OJ 287, a binary BH system showed similar behaviours. A secondary BH orbits the primary every 12.7 years and every pass at aphelion and perihelion outbursts of flames have been observed.
The theory also predicts that a stellar object orbiting E-W will have a circular orbit profile because E-W experiences nonfluctuating relatively low gravity. This prediction seems to be contradicted by S38, which orbits E-W (perpendicular to S2) and is simulated as having a Keplerian orbit. The path of S38 is one of the least identified in yearly telescope surveys. A recent study identified more speckles from telescope images of past surveys along an E-W Keplerian orbit. A time-series analysis of the new speckles identified as the orbit of S38 places S38 in a cross path with S2 around the pericenter in 2020, an event that should have been recognized because S2 has been closely followed since 2018. An alternative time-series analysis based on a 26-year circular orbit profile proposes that S38 is 10 years away from the pericenter and that some speckles attributed to S122/55 could be of S38. It is proposed that a new search for S38 speckles along a circular orbit may identify the entire path and current position of S38.
The effect of the bipolar high-gravity topology model can be demonstrated in less intense environments, such as planetary systems. Surveys of the solar system seem to reveal similar behaviours. Jupiter with 79 moons provides a large population of orbiting stellar objects. Among the orbiting moons, eight are orbiting E-W and have a low inclination with respect to Jupiter’s equatorial plane and low eccentricity (circular orbit profile). The rest of the moons orbit N-S with a high inclination and high eccentricity (elliptical orbit). Another stellar event is the arrival of Oumuamua travelling N-S to the Sun and then turning in a “slingshot” path toward the east. Simulating the hyperbolic trajectory based on the known gravity of the Sun gave the predicted exit path and speed. The actual escape angle was less acute, and the speed was higher than predicted. Both variables point to the fact that the gravity of the Sun E-W is lower than the known gravity of the Sun. This is predicted by the bipolar high-gravity topology theory.
The MW GC is another example of a bipolar high-gravity topology model. While the S stars orbit N-S, other stars in the NSC farther from Sgr A*, which belong to multiple groups and are in different life cycle stages, are orbiting parallel to the motion of the galaxy (E-W). The concentration of gravity (ST curvature) in the N–S corridor provides a low-gravity and stable environment E-W, which is a habitable zone for all other stellar objects in the galaxy.
The study of the motion of stellar objects orbiting in the N-S direction around an attractor provides a non-Keplerian alternative mechanical explanation of elliptical orbits while exploring the topology of ST gravitational forces where nonuniform gravitational forces shape the galaxies around the BH. This explains some astronomical events, such as the phenomena of the accretion disks and their inner working, AGN energy outbursts through a narrow shaft from the poles, and flat galaxies, which provide habitable zones for stars and planets.
References
- Chatzopoulos S, Fritz TK, Gerhard O, et al. The old nuclear star cluster in the Milky Way: dynamics, mass, statistical parallax, and black hole mass. Mon Not R Astrom Soc. 2015;447(1):948-68.
- Bondi H, Hoyle F. On the mechanism of accretion by stars. Mon Not R Astrom Soc. 1944;104(5):273-82.
- Bondi H. On spherically symmetrical accretion. Mon Not R Astrom Soc. 1952;112(2):195-204.
- Russell HR, Fabian AC, Broderick AE, et al. Inside the Bondi radius of M87. Mon Not R Astrom Soc 2015;451(1):588-600.
- Hawkins MR. Naked active galactic nuclei. Astron Astrophys. 2004;424(2):519-29.
- Silverstein EM, Anderson ME, Bregman JN. Increased Prevalence of Bent Lobes for Double-lobed Radio Galaxies in Dense Environments. Astron J. 2017;155(1):14.
- Antonucci R. Unified models for active galactic nuclei and quasars. Annu rev astron astrophys.1993;31:473-521.
- Blandford RD, Rees MJ. A ‘twin-exhaust’ model for double radio sources. Mon Not R Astrom Soc. 1974;169(3):395-415.
- MacFadyen AI, Woosley SE, Heger A. Supernovae, jets, and collapsars. Astron J. 2001 Mar 20;550(1):410.
- Heckman TM, Best PN. The coevolution of galaxies and supermassive black holes: insights from surveys of the contemporary universe. Annu rev astron astrophys. 2014; 52:589-660.
- Antonucci R. Unified Models: Religion and Science. In Symp Int Astron Union. 1994; 159:301-309.
- Alloin D, Johnson R, Lira P. Physics of active galactic nuclei at all scales. Springer. 2006.
- Netzer H. Revisiting the unified model of active galactic nuclei. Annu rev astron astrophys. 2015; 53:365-408.
- Frank A. Bipolar outflows and the evolution of stars. New Astron Rev. 1999;43(1):31-65.
- Gull SF, Northover KJ. Bubble model of extragalactic radio sources. Nature. 1973;244(5411):80-3.
- Krishnan VV, Bailes M, Van Straten W et al. Lense Thirring frame dragging induced by a fast-rotating white dwarf in a binary pulsar system. Science. 2020;367(6477):577-80.
- Domiciano de Souza. A Flattest Star Ever Seen-VLT Interferometer Measurements of Achernar Challenge Stellar Theory. ESO, 2003(0316).
- Bouchaud K, De Souza AD, Rieutord M et al. A realistic two-dimensional model of Altair. Astron Astrophys. 2020; 633:78.
- Lara FE, Rieutord M. Self-consistent 2D models of fast-rotating early-type stars. Astron Astrophys. 2013; 552:35.
- Rieutord M, Lara FE, Putigny B. An algorithm for computing the 2D structure of fast rotating stars. J. Comput. Phys. 2016; 318:277-304.
- Wang J, Miesch MS, Liang C. Convection in oblate solar-type stars. Astron J. 2016;830(1):45.
- Keto E, Zhang Q. The standard model of star formation applied to massive stars: accretion discs and envelopes in molecular lines. Mon Not R Astron Soc. 2010;406(1):102-11.
- Spruit HC. Dynamo action by differential rotation in a stably stratified stellar interior. Astron Astrophys. 2002;381(3):923-32.
- Rüdiger G, Gellert M, Spada F et al. The angular momentum transport by unstable toroidal magnetic fields. Astron Astrophys. 2015; 573:80.
- Ilee JD, Cyganowski CJ, Brogan CL et al. A Fragmented Keplerian Disk Surrounding a Proto O Star. Astrophys J Lett. 2018;869(2):L24.
- Kraus M, Fernandes MB, De Araujo FX. Neutral material around the B supergiant star LHA 115-S 65-An outflowing disk or a detached Keplerian rotating disk? Astron Astrophys. 2010; 517:30.
- Schödel R, Merritt D, Eckart A. The nuclear star cluster of the Milky Way: proper motions and mass. Astron Astrophys. 2009;502(1):91-111.
- Rubilar GF, Eckart A. Periastron shifts of stellar orbits near the Galactic Center. Astron Astrophys. 2001;374(1):95-104.
- Gillessen S, Plewa PM, Eisenhauer F et al. An update on monitoring stellar orbits in the galactic center. Astrophys J. 2017;837(1):30.
- Boehle A, Ghez AM, Schödel R et al. An improved distance and mass estimate for Sgr A* from a multistar orbit analysis. Astrophys J. 2016;830(1):17.
- Parsa M, Eckart A, Shahzamanian B et al. Investigating the relativistic motion of the stars near the supermassive black hole in the galactic center. Astrophys J. 2017;845(1):22.
- Ghez AM, Duchêne G, Matthews K et al. The first measurement of spectral lines in a short-period star bound to the galaxy’s central black hole: a paradox of youth. Astrophys J Lett. 2003;586(2):127.
- Meyer L, Ghez AM, Schödel R, et al. The shortest-known–period star orbiting our galaxy’s supermassive black hole. Science. 2012;338(6103):84-7.
- Chu DS, Hees A, Ghez A et al. Investigating the Binarity of S0-2: Implications for its Origins and Robustness as a Probe of the Laws of Gravity around a Supermassive Black Hole. Astrophys J. 2018;854(1):12.
- Gillessen S, Eisenhauer F, Alexander Tet al. Monitoring stellar orbits around the Massive Black Hole in the Galactic Center. Astrophys J. 2009;692(2):1075.
- Schödel R, Ott T, Genzel R et al. A star in a 15.2-year orbit around the supermassive black hole at the centre of the Milky Way. Nature. 2002;419(6908):694-6.
- Abuter R, Amorim A, Anugu N et al. Detection of the gravitational redshift in the orbit of the star S2 near the Galactic centre massive black hole. Astron Astrophys. 2018 ;615:15.
- Witzel G, Gautam AK, Chen Z et al. Unprecedented variability of Sgr A* in NIR. 2019.
- Genzel R, Schödel R, Eisenhauer F et al. The stellar cusp around the supermassive black hole in the galactic center. The Astrophys J. 2003;594(2):812.
- Trippe S, Paumard T, Gillessen S et al. A polarized infrared flare from Sagittarius A* and the signatures of orbiting plasma hotspots. Mon Not R Astron Soc. 2007;375(3):764-72.
- Alexander T. Stellar processes near the massive black hole in the Galactic center. Phys Rep. 2005;419(2-3):65-142.
- Gillessen S, Genzel R, Fritz TK et al. New observations of the gas cloud G2 in the galactic center. Astrophys J. 2013;763(2):78.
- Gillessen S, Plewa PM, Widmann F et al. Detection of a drag force in G2's orbit: Measuring the density of the accretion flow onto Sgr A* at 1000 Schwarzschild radii. Astrophys J. 2019;871(1):126.
- Valtonen MJ, Mikkola S, Merritt D et al. Measuring the spin of the primary black hole in OJ287. Astrophys J. 2010;709(2):725.
- Valtonen M, Kidger M, Lehto H et al. The structure of the October/November 2005 outburst in OJ287 and the precessing binary black hole model. Astron Astrophys. 2008;477(2):407-12.
- Valtonen M, Zola S, Jermak H et al. Polarization and spectral energy distribution in OJ 287 during the 2016/17 outbursts. Galaxies. 2017;5(4):83.
- Dey L, Valtonen MJ, Gopakumar A et al. Authenticating the presence of a relativistic massive black hole binary in OJ 287 using its general relativity centenary flare: Improved orbital parameters. Astrophys J. 2018;866(1):11.
- Sundelius B, Wahde M, Lehto HJ et al. A numerical simulation of the brightness variations of OJ 287. Astrophys J. 1997;484(1):180.
- Laine S, Dey L, Valtonen M et al. Spitzer Observations of the Predicted Eddington Flare from Blazar OJ 287. Astrophys J L. 2020;894(1):1.
- Meech KJ, Weryk R, Micheli M et al. A brief visit from a red and extremely elongated interstellar asteroid. Nature. 2017;552(7685):378-81.
- Micheli M, Farnocchia D, Meech KJ, et al. Non-gravitational acceleration in the trajectory of 1I/2017 U1 (‘Oumuamua). Nature. 2018;559(7713):223-6.