Original Article
, Volume: 17( 1)Validated Isocratic/Gradient RP-HPLC for Simultaneous Estimation of Paracetamol Ibuprofen and Caffeine in Marketed Formulations Using Diclofenac as Internal Standard
- *Corresponding author:
- Dushyanth Reddy V Department of Pharmaceutical Chemistry, KLE's University College of Pharmacy, KLE University, Belagavi 590001, India
Tel: 08312471399; E-mail: dushyanthreddy233@gmail.com
Received: October 16, 2016 Accepted: January 16, 2017 Published: January 22, 2017
Citation: Palled PJ, Dushyanth Reddy V, Mannor VS, et al. Validated Isocratic/Gradient RP-HPLC for Simultaneous Estimation of Paracetamol Ibuprofen and Caffeine in Marketed Formulations Using Diclofenac as Internal Standard. Anal Chem Ind J. 2017;17(1):116.
Abstract
Objective: To develop a validated RP-HPLC method for simultaneous estimation of Paracetamol Ibuprofen and Caffeine. Methods: The HPLC instrument used was Shimadzu LC-20AD with reverse phase ODS-Hypersil-C18 (250 mm × 4.6 mm, 5 μm) column using Acetonitrile:water (90:10) pH adjusted to 2.8 as mobile phase. The flow rate was maintained at 0.3 ml/min and UV detection was carried at 203 nm.
Results: The method was validated for linearity, accuracy, precision, specificity, robustness and ruggedness according to ICH guidelines. The retention time for Paracetamol, Ibuprofen and Caffeine was found to be 9.7, 12.66 and 10.48 respectively. The regression analysis showed good linearity over the concentration range of 1.25 μg/ml to 20 μg/ml for paracetamol, 0.625 μg/ml to 10 μg/ml for Ibuprofen and 0.625 μg/ml to 10 μg/ml for Caffeine. The recovery studies of the method gave good results in the range of 99.89% to 100.48% with less than 2% of RSD.
Conclusion: The method was found to be suitable for the analysis of marketed formulation in presence of other excipients.
Keywords
Paracetamol; HPLC; Chromatography; Ibuprofen; Anti-inflammatory
Introduction
Paracetamol (Acetaminophen) is chemically N-(4-hydroxyphenyl) acetamide is a crystalline solid is a sparingly soluble compound which is classified under antipyretic analgesics. Drugs Classified under this class possess analgesic and antipyretic activity but lacks anti-inflammatory effects indicated for use in patients who are sensitive to aspirin with usual adult dosage 325 mcg to 650 mcg dose greater than 2.6 g/day are not advisable for prolonged treatment owing to its hepatotoxicity. Antipyretic effect of acetaminophen affords to the inhibition of endogenous leukocytic pyrogens released from cells upon external stimuli or upon activation with exogenous pyrogen. acetaminophen possesses analgesic activity in arthritis and musculoskeletal disorders.
Acetaminophen is available in various formulations say suppositories, tablets, capsules, granules and solutions. Ibuprofen is chemically 2-(4-isobutylphenyl) propionic acid is a crystalline solid is a sparingly soluble compound. It is classified as Non-Steroidal anti-inflammatory drug it was the first NSAID approved after Indomethacin. First NSAID to become over the counter (OTC) drugs. It is marketed as racemic mixture even its biological response owed almost evidently with S-(+) isomer. Ibuprofen is more potent than aspirin but less effective than indomethacin. Ibuprofen produces moderate levels of gastric irritation [1]. ibuprofen is indicated in patients suffering with rheumatoid arthritis, osteoarthritis, fever and dysmenorrhea. Caffeine is chemically 1,3,7-trimethyl-1H-purine-2,6(3H,7H)-dione acetamide is a crystalline solid is a sparingly soluble compound which is chemically methyl xanthines naturally occur in coffee (coffee Arabica) which is generally termed as stimulant and as a bronchodilator. caffeine is generally added to other OTC analgesic and stimulants.
Methodology
1. UV Profiling of API's
2. HPLC Method Development
a. Isocratic
b. Gradient
3. Selection of Internal Standard
4. Assay Methodology for Quantification of API's
Chromatography
Ultraviolet spectroscopy (absorption spectroscopy) is one of the most widely used technique for quantification of organic and inorganic molecules. Chromatography is a technique for separation of organic molecules. Hyphenated instrumentation technique say (HPLC-UV/LC-MS/LC-NMR) is a technique to reconcile output abnormalities of one instrument with input abnormalities of other instruments. Lower edge or conventional instruments say UV/Fluorescence/IR serve as detectors in high end or Hyphenated instrumentation technique say (HPLC-UV/LC-MS/LC-NMR). High Performance Liquid Chromatography is a technique of separation of molecules (in μg-ng/mL) in shorter time. Various literature reported HPLC methods are available for simultaneous estimation of paracetamol and ibuprofen either alone or in combination with other API's but very few direct HPLC method for simultaneous estimation of paracetamol, ibuprofen and caffeine according our knowledge. We employ a criteria of standard addition method for inclusion of internal standard in quantification of API's.
UV profiling of API's
As the current research work is executed with HPLC with UV detector (Dual Wavelength detector), we had performed spectral scan for all the API's of interest both individually and simultaneously. Our aim was to identify an isobestic point (wavelength at which all API's have common absorbance). Identification of Isobestic point using UV spectroscopy is the criteria for wavelength selection in HPLC-UV. In UV scan of API's Paracetamol, Ibuprofen and Caffeine (absorption maxima as a function of wavelength) Figures. 1 and 2 isobestic point was found to be 203 nm. The same wavelength was selected in HPLC-UV(LC-20-AD).

Figure 1: Absorbance maxima as a function of wavelength.

Figure 2: Absorption maxima of Caffeine and isobestic point.
HPLC Method Development
Mobile phase selection
Various combinations of mobile phases with and without buffer at varied pH from 2-8, with more emphasis on final pH of mobile phase is adjusted to ± 2 units of pka value of API. Various combinations of mobile phase tried are highlighted in Table.
Column or stationary phase selection
Various stationary phases (columns) have been screened for current research, the best fit column with respect to tailing factors and theoretical plates, eventually ODS Hypersil C18 was selected for analysis.
Materials, reagents and chemicals
Paracetamol, Ibuprofen and Caffeine pure drug was obtained as gift sample from Sun Pharma Sparc Research Centre Vadodara. The other chemicals like methanol, acetonitrile and milli-Q waters were procured from Milli pore water system available at BSRC. The tablet dosage forms imol plus procured from local market [2].
Instrumentation
UV instrument consist of Shimadzu UV, PH meter, Milli pore water purification system. The HPLC system consist of Shimadzu LC 20AD, Hamilton injector of 20 μl capacity and detected by SPD-20A UV detector with LC-Solutions software. The stationary phase used is reverse phase ODS-Hypersil-C18.
Chromatographic conditions
The mobile phase consists of Acetonitrile:water (90:10) pH adjusted to 2.8, all the solvents used in analysis are filtered through 0.45 μ Sartorius filter paper, degassed by ultra-sonication for 10 min. The flow rate was maintained at 0.3 ml/min. Aliquots of the samples (20 μl) (injection volume) were injected and the total run was kept at 20 min. the chromatogram was monitored at 203 nm.
Standard solutions and Calibration curves
The standard stock solutions of the drug was prepared by dissolving 10 mg pure drug in 100 ml of mobile phase. Serial dilutions were made from stock solutions using acetonitrile.
Sample preparation
Ten tablets of Paracetamol, Ibuprofen and Caffeine were weighed and grinded into fine powder in mortar and pestle. A mass of powder equivalent to 100 mg of Paracetamol, Ibuprofen and Caffeine was accurately weighed and transferred to a volumetric flask containing acetonitrile. The resultant solution was sonicated for 5 min and filtered through nylon filter and the volume was made up to 100 ml using acetonitrile. serial dilutions were made from the stock solution of formulation, and were analyzed for their recovery studies [3].
Method validation
The method was validated according to the ICH guidelines for the following parameters.
Linearity and sensitivity
Standard solutions of Paracetamol, Ibuprofen and Caffeine was prepared in the concentration range of 5 μg/ml to 25 μg/ml. Then 20 μl of each solution were injected in triplicate on to the column and the chromatogram was developed using above mobile phase Acetonitrile:water (90:10) pH adjusted to 2.8 ratio. The RF values were plotted against the corresponding concentration to obtain the calibration graph. The LOD and LOQ were calculated based on the equation: LOD=3.3 × A/B and LOQ=10 × A/B. Where, A is SD of peak areas of the drugs taken as a measure of noise and B is the slope of corresponding calibration curve Figures. 3- 5.

Figure 3: Chromatogram of paracetamol linearity graph of paracetamol.

Figure 4: Chromatogram of Ibuprofen linearity graph of Ibuprofen.

Figure 5: Chromatogram of Caffeine linearity graph of Caffeine.
Precision
The interday and intraday precision studies were conducted by using three different concentrations of the standard (initial, medium and final concentrations) in triplicate in a day and on three consecutive days.
Accuracy
The accuracy of the method was examined by performing recovery studies in triplicate using standard addition method (50%, 100% and 150%). Accurately known amount of sample was added to a known amount of pre-analyzed tablet powder and was analyzed (Table 1).
| Parameter | Paracetamol | Ibuprofen | Caffeine |
|---|---|---|---|
| Retention time (Rt) | 9.7 | 12.66 | 10.48 |
| Linearity range (µg/ml) | 1.25 µg/ml to 20 µg/ml | 0.625 µg/ml to 10 µg/ml | 0.625 µg/ml to 10 µg/ml |
| Regression equation | y=61963x + 11807 | y=31198x +77914 | y=59842x +42403 |
| Limit of detection (µg/ml) | 0.28481225 | 0.187937934 | 0.264438458 |
| Limit of quantification (µg/ml) | 0.94937417 | 0.626459779 | 0.881461526 |
| Regression coefficient (r2) | 0.999 | 0.999 | 0.999 |
Table 1. Linearity parameters for calibration curve.
| Paracetamol | Caffeine | Ibuprofen | ||||||
|---|---|---|---|---|---|---|---|---|
| Peak Area | Conc. | RSD | Peak Area | Conc. | RSD | Peak Area | Conc. | RSD |
| 888147 | 1.25 | 0.69258 | 783034 | 1.25 | 0.442707 | 470798 | 1.25 | 0.692588 |
| 1659642 | 2.5 | 0.53228 | 1527003 | 2.5 | 0.69224431 | 869036.667 | 2.5 | 0.53228782 |
| 3197167 | 5 | 0.36195 | 3035632 | 5 | 0.709403 | 1645744 | 5 | 0.361959 |
n=3
Table 1a. Accuracy.
| S.no | Intra Day Precession | Inter day precession | ||||
|---|---|---|---|---|---|---|
| Paracetamol | Ibuprofen | Caffeine | Paracetamol | Ibuprofen | Caffeine | |
| 1 | 6385180 | 3189497 | 5990397 | 6385180 | 3189497 | 5990397 |
| 2 | 6394967 | 3179829 | 6011626 | 6394967 | 3179829 | 6011626 |
| 3 | 6498615 | 3218876 | 6057253 | 6498615 | 3218876 | 6057253 |
| 4 | 6401950 | 3184222 | 6014400 | 6400632 | 3186556 | 5960127 |
| 5 | 6342337 | 3204056 | 5944931 | 6366615 | 3256463 | 5917302 |
| 6 | 6400594 | 3223011 | 5978122 | 6394706 | 3199781 | 5987988 |
| AVG | 6403941 | 3199915.167 | 5999455 | 6406786 | 3205167 | 5987449 |
| SD | 51392.4 | 18266.60881 | 38005.54 | 46554.44 | 28573.27 | 47187.29 |
| RSD | 0.802512 | 0.570846659 | 0.633483 | 0.726643 | 0.891475 | 0.788103 |
n=3
Table 1b. Precision.
Robustness
Robustness of the method was determined by introducing small changes in the mobile phase composition, change in flow rate and detection wavelength. During initial stages of development of method, the method was subjected to small changes and the effect of small changes in method on the detection of Paracetamol, Ibuprofen and Caffeine with respect to peak shape, RT values and stability were studied (Tables 2-5).
| Mobile Phase |
Flow | Theoretical plates | Tailing factor | ||||
|---|---|---|---|---|---|---|---|
| AVG | STDEV | RSD | AVG | STDEV | RSD | ||
| 90 : 10 | 0.5 | 12323.978 | 56.20974539 | 0.456100663 | 0.93933333 | 0.00305505 | 0.325236032 |
| 90 : 10 | 0.7 | 9067.419667 | 78.84922682 | 0.869588369 | 0.888 | 0.00953939 | 1.074255857 |
| 88 : 12 | 0.5 | 15478.77167 | 135.7386882 | 0.876934495 | 0.99166666 | 0.00709459 | 0.715421736 |
| 88 : 12 | 0.7 | 11609.59933 | 154.6095267 | 1.331738695 | 1.021 | 0.00754983 | 0.739454891 |
| 92 : 08 | 0.5 | 5950.82 | 40.23684315 | 0.67615628 | 0 | 0 | 0 |
| 92 : 08 | 0.7 | 4445.731 | 49.73684297 | 1.118755115 | 0 | 0 | 0 |
Table 2. Robustness study for Paracetamol.
| Mobile Phase |
Flow | Theoretical plates | Tailing factor | ||||
|---|---|---|---|---|---|---|---|
| AVG | STDEV | AVG | STDEV | ||||
| 90 : 10 | 0.5 | 12864.37067 | 116.9338918 | 90 : 10 | 0.5 | 12864.37067 | 116.9338918 |
| 90 : 10 | 0.7 | 11470.76967 | 130.9244533 | 90 : 10 | 0.7 | 11470.76967 | 130.9244533 |
| 88 : 12 | 0.5 | 14257.88433 | 209.0422122 | 88 : 12 | 0.5 | 14257.88433 | 209.0422122 |
| 88 : 12 | 0.7 | 12586.42633 | 104.8210764 | 88 : 12 | 0.7 | 12586.42633 | 104.8210764 |
| 92 : 08 | 0.5 | 12718.54433 | 71.83204801 | 92 : 08 | 0.5 | 12718.54433 | 71.83204801 |
| 92 : 08 | 0.7 | 11747.39667 | 135.0314692 | 92 : 08 | 0.7 | 11747.39667 | 135.0314692 |
Table 3. Robustness parameters of Ibuprofen.
| Mobile Phase |
Flow | Theoretical plates | Tailing factor | ||||
|---|---|---|---|---|---|---|---|
| AVG | STDEV | RSD | AVG | STDEV | RSD | ||
| 90 : 10 | 0.5 | 15841.41867 | 104.1076266 | 0.657186258 | 1.31 | 0.007549834 | 0.576323239 |
| 90 : 10 | 0.7 | 12461.14467 | 201.2005414 | 1.614623269 | 1.361 | 0.02433105 | 1.787733293 |
| 88 : 12 | 0.5 | 16618.58767 | 209.3578273 | 1.259781105 | 1.2573 | 0.011590226 | 0.921810109 |
| 88 : 12 | 0.7 | 13637.39533 | 201.6091045 | 1.478354918 | 1.324 | 0.012529964 | 0.94637191 |
| 92 : 08 | 0.5 | 14483.07133 | 84.91817942 | 0.58632715 | 0 | 0 | 0 |
| 92 : 08 | 0.7 | 12089.129 | 67.05188783 | 0.554646144 | 0 | 0 | 0 |
Table 4. Robustness parameters of Caffeine.
| Ruggedness study for Paracetamol | Ruggedness study for Ibuprofen | Ruggedness study for Caffeine | |||||
|---|---|---|---|---|---|---|---|
| S.NO | Analysit-1 | Analyst-2 | Analyst-1 | Analyst-2 | Analyst-1 | Analyst-2 | |
| 1 | Peak area | 3208599 | 3240878 | 1641232 | 1686064 | 3051201 | 3020092 |
| 2 | Peak area | 3193454 | 3148553 | 1652496 | 1699056 | 3044639 | 3116484 |
| 3 | Peak area | 3189449 | 3238949 | 1643503 | 1681409 | 3011056 | 3097548 |
| AVG | 3197167 | 3209460 | 1645744 | 1688843 | 3035632 | 3078041 | |
| STDEV | 10100.61 | 52755.83 | 5956.917 | 9145.834 | 21534.85 | 51070.9 | |
| RSD | 0.315924 | 1.64376 | 0.361959 | 0.541544 | 0.709403 | 1.659201 | |
Table 5. Ruggedness.
Results and Discussion
Optimization of the RP-HPLC method
Various solvent systems were evaluated to obtain better chromatogram. Initially, methanol, HPLC grade water, acetate buffer, acetonitrile and phosphate buffer were tried in different ratios [4]. But the resolution was not satisfactory. Finally, the mobile phase consisting of Acetonitrile:water (90:10) pH adjusted to 2.8 found to be optimum.
Linearity and sensitivity
The linearity was evaluated by determining six working standard solutions containing 5 μg/ml to 25 μg/ml of Paracetamol, Ibuprofen and Caffeine in triplicate with good correlation coefficient in the concentration range. (r=0.989). The LOD and LOQ was found to be 0.0532 μg/ml and 2.344 μg/ml respectively Figures. 6- 8.

Figure 6: Chromatogram without Baseline Correction with Baseline Correction.

Figure 7: Chromatogram without internal standard Chromatogram with internal standard.

Figure 8: Chromatogram of Standard Assay Chromatogram of Assay of Formulation.
Assay
The amount of Paracetamol, Ibuprofen and Caffeine present per tablet was calculated by comparing the peak area, with that of the internal standard.
Selection and role of internal standard
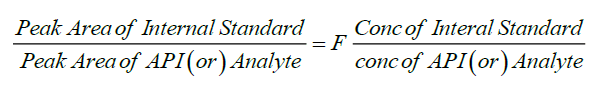
Conventional quantification techniques carry an error, to minimize the error in analysis, recovery and quantification of API was done with respect to internal standard method. criteria for selection of internal standard; structurally similar compounds have similar retention times, diclofenac is used as internal standard [5]. The conventional quantification technique (using linearity and regression is obsolete and carry certain amount of random error. Internal standard analysis always carry standard amount of determinate error throughout the analysis.
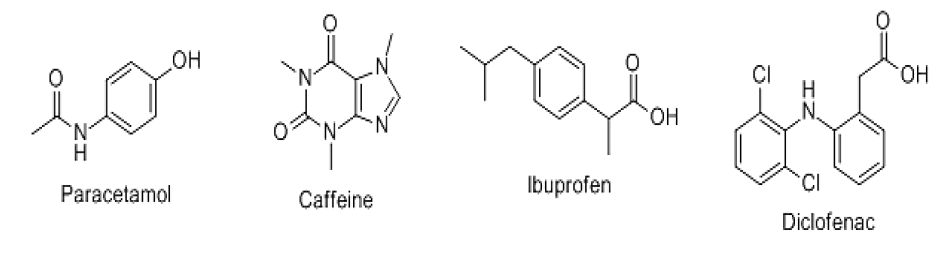
The structures of API's were drawn using Chem. Draw Ultra-10
Assay Methodology
Recovery experiment
To study the accuracy, reproducibility and the precision of the proposed method recovery experiments were carried out. A fixed amount of pre-analyzed sample was taken and standard drug was added at three different concentrations and each level was repeated for 3 times. The recovery was estimated to be more than 100% [6].
Validated gradient RP-HPLC method for estimation of Paracetamol, Caffeine and Ibuprofen
Stationary phase: C18 250 mm × 4.6 mm, 5 μ, Inertsil ODS 3V.
Mobile phase A: 6.8 gm of KH2PO4 in 1L Milli-Q water pH adjusted to 3 with Orthophosphoric acid
Mobile phase B: Filtered and degassed Acetonitrile (HPLC grade).
Detector: UV at wavelength 230 nm.
Flow rate: 1 mL/min (Run Time 30mins)
Injection volume: 20 μl
Mode: Gradient
Elution order: Paracetamol, Caffeine and Ibuprofen.
Retention time: Paracetamol,Caffeine and Ibuprofen is 6, 8 and 17 min (Table 6), Figures. 9 and 10.

Figure 9: HPLC (Gradient) Chromatogram of paracetamol, Ibuprofen and Caffeine.

Figure 10: HPLC (Isocratic) chromatogram of Paracetamol, Ibuprofen and Caffeine.
| Time | KH2PO4 Buffer pH 3.0 | Acetonitrile |
|---|---|---|
| 0.01 | 85 | 15 |
| 5 | 85 | 15 |
| 12 | 25 | 75 |
| 20 | 25 | 75 |
| 22 | 85 | 15 |
| 30 | 85 | 15 |
Table 6. Gradient programming.
Preparation of samples and standard stock solution A: Weigh accurately 130 mg of Paracetamol, 16 mg Caffeine, and 80 mg Ibuprofen into a 50 ml volumetric flask. Add sufficient amount of methanol, sonicate to dissolve, cool and dilute up to the mark with methanol. The above stock solution was further diluted 5 ml to 100 ml with methanol [6].
Standard stock solution B: Weigh accurately 136.5 mg of Paracetamol, 16.8 mg Caffeine, and 84 mg Ibuprofen into a 50 ml volumetric flask. Add sufficient amount of methanol, sonicate to dissolve, cool and dilute up to the mark with methanol. The above stock solution was further diluted 5 ml to 100 ml with methanol.
Sample stock solution: Twenty tablets were weighed accurately and finely powdered. The powder equivalent to 1 tablet was taken in a 50 ml volumetric flask, methanol was added and sonicate for 20 minutes, cool and further diluted up to the mark with methanol. The above stock solution was further diluted 2 ml to 100 ml with methanol. Then filtered through 0.45 μ membrane filter.
Placebo for Paracetamol: Weigh accurately 0.135 gm of placebo taken into 50 ml volumetric flask. Add 16 mg Caffeine, 80 mg Ibuprofen and sufficient amount of methanol, sonicate for 20 minutes, cool and dilute up to the mark with methanol. The above solution further diluted 5 ml to 100 ml with methanol. Then filtered through 0.45 μ membrane filter.
Placebo for Caffeine: Weigh accurately 0.135 gm of placebo taken into 50 ml volumetric flask. Add 130 mg Paracetamol, 80 mg Ibuprofen and sufficient amount of methanol, sonicate for 20 minutes, cool and dilute up to the mark with methanol. The above solution further diluted 5 ml to 100 ml with methanol. Then filtered through 0.45 μ membrane filter.
Placebo for Ibuprofen: Weigh accurately 0.135 g of placebo taken into 50 ml volumetric flask. Add 130 mg Paracetamol, 16 mg Caffeine and sufficient amount of methanol, sonicate for 20 min, cool and dilute up to the mark with methanol. The above solution further diluted 5 ml to 100 ml with methanol. Then filtered through 0.45 μ membrane filter (Tables 7-10).
| Sample Name | Peak area Paracetamol |
Retention time | Area Caffeine |
Retention time | Peak area of Ibuprofen | Retention time | Similarity factor Paracetamol/Ibuprofen/Caffeine |
|---|---|---|---|---|---|---|---|
| STD A | 7557233 | 6.32 | 564849 | 8.54 | 2016114 | 17.58 | |
| STD A | 7580906 | 6.31 | 566807 | 8.53 | 2020175 | 17.57 | |
| STD A | 7588646 | 6.31 | 567043 | 8.52 | 2022898 | 17.57 | |
| STD A | 7587502 | 6.31 | 567267 | 8.52 | 2021357 | 17.57 | |
| STD A | 7584143 | 6.30 | 566700 | 8.49 | 2019249 | 17.57 | |
| STD A | 75944237 | 6.30 | 567367 | 8.49 | 2021417 | 17.56 | |
| STD B | 7568881 | 6.31 | 565933 | 8.50 | 2016610 | 17.56 | 0.98 |
| RSD | 0.17% | 0.11% | 0.16% | 0.22% | 0.12% | 0.03% |
Table 7. Data of specificity test for Paracetamol.
| Parameter | Acceptance | Paracetamol | Caffeine | Ibuprofen |
|---|---|---|---|---|
| Theoretical Plates | NLT 2000 | 7771 | 10581 | 135129 |
| Tailing Factor | NMT 2 | 1.0 | 1.1 | 1.1 |
| Capacity Factor | NLT 2 | 1.5 | 2.4 | 6.0 |
| Similarity Factor | 0.98 to 1.02 | 0.98 | 0.98 | 0.98 |
| %RSD of STD A for Area | NMT 2 | 0.17% | 0.16% | 0.12% |
| %RSD of STD A for RT | NMT 2 | 0.11% | 0.22% | 0.03% |
| %RSD of STD for Area | NMT 2 | 0.17% | 0.18% | 0.20% |
| %RSD of STD for Retention time | NMT 2 | 0.11% | 0.22% | 0.04% |
The given method is specific.
Table 8. System Suitability.
| Sample Name | Paracetamol | Caffeine | Ibuprofen | ||||||
|---|---|---|---|---|---|---|---|---|---|
| Area | Amount mg/tab |
% Label Claim | Area | Amount mg/tab |
% Label Claim | Area | Amount mg/tab |
% Label Claim | |
| 1 | 7402044 | 318.8 | 98.1 | 550272 | 39.4 | 98.6 | 2019414 | 200.1 | 100.1 |
| 2 | 7424325 | 319.8 | 98.4 | 552223 | 39.6 | 99.0 | 2026164 | 200.8 | 100.4 |
| 3 | 7437356 | 320.5 | 98.6 | 553173 | 39.7 | 99.2 | 2028301 | 201.1 | 100.6 |
| 4 | 7485967 | 322.8 | 99.3 | 554184 | 39.8 | 99.4 | 2033877 | 201.8 | 100.9 |
| 5 | 7550710 | 325.6 | 100.2 | 558013 | 40.1 | 100.1 | 2042587 | 202.7 | 101.4 |
| 6 | 7552770 | 325.2 | 100.1 | 557624 | 40 | 99.9 | 2042212 | 202.3 | 101.2 |
| SD | 2.881 | 0.886 | 0.229 | 0.573 | 0.972 | 0.486 | |||
| % RSD | 0.89 | 0.89 | 0.58 | 0.58 | 0.48 | 0.48 | |||
Table 9. Repeatability of Paracetamol Ibuprofen and Caffeine.
| Parameter | Acceptance | Paracetamol | Caffeine | Ibuprofen |
|---|---|---|---|---|
| %RSD of Assay | NMT 2 | 0.89 | 0.58 | 0.48 |
| Similarity Factor | 0.98 to 1.02 | 0.98 | 0.98 | 0.98 |
Table 10. Summary of repeatability.
Linearity
Standard solution (50% Level): Weigh accurately 32.50 mg of Paracetamol, 4.02 mg Caffeine, and 21.0 mg Ibuprofen into a 50 ml volumetric flask. Add sufficient amount of methanol, sonicate to dissolve, cool and dilute up to the mark with methanol. The above stock solution was further diluted 2 ml to 100 ml with methanol.
Standard solution (60% Level): Weigh accurately 39.3 mg of Paracetamol, 4.83 mg Caffeine, and 25.5 mg Ibuprofen into a 50 ml volumetric flask. Add sufficient amount of methanol, sonicate to dissolve, cool and dilute up to the mark with methanol. The above stock solution was further diluted 2 ml to 100 ml with methanol.
Standard solution (80% Level): Weigh accurately 52.80 mg of Paracetamol, 46.42 mg Caffeine, and 34.1 mg Ibuprofen into a 50 ml volumetric flask. Add sufficient amount of methanol, sonicate to dissolve, cool and dilute up to the mark with methanol. The above stock solution was further diluted 2 ml to 100 ml with methanol.
Standard solution (100% Level): Weigh accurately 64.90 mg of Paracetamol, 8.06 mg Caffeine, and 40.5 mg Ibuprofen into a 50 ml volumetric flask. Add sufficient amount of methanol, sonicate to dissolve, cool and dilute up to the mark with methanol. The above stock solution was further diluted 2 ml to 100 ml with methanol.
Standard solution (120% Level): Weigh accurately 77.30 mg of Paracetamol, 9.62 mg Caffeine, and 48.5 mg Ibuprofen into a 50 ml volumetric flask. Add sufficient amount of methanol, sonicate to dissolve, cool and dilute up to the mark with methanol. The above stock solution was further diluted 2 ml to 100 ml with methanol.
Standard solution (140% Level): Weigh accurately 90.0 mg of Paracetamol, 11.18 mg Caffeine, and 56.5 mg Ibuprofen into a 50 ml volumetric flask. Add sufficient amount of methanol, sonicate to dissolve, cool and dilute up to the mark with methanol. The above stock solution was further diluted 2 ml to 100 ml with methanol.
Standard solution (150% Level): Weigh accurately 32.50 mg of Paracetamol, 4.02 mg Caffeine, and 21.0 mg Ibuprofen into a 50 ml volumetric flask. Add sufficient amount of methanol, sonicate to dissolve, cool and dilute up to the mark with methanol [7]. The above stock solution was further diluted 2 ml to 100 ml with methanol (Tables 11-20).
| Sample Name | Level | Paracetamol | Caffeine | Ibuprofen | ||||||
|---|---|---|---|---|---|---|---|---|---|---|
| Peak Area | Conc. | Response Factor | Peak Area | Conc. | Response Factor | Peak Area | Conc. | Response Factor | ||
| 1 | 50% | 64188 | 64.80 | 59372.5 | 4731 | 8.01 | 35378.8 | 17414 | 41.92 | 24958.2 |
| 2 | 60% | 77398 | 78.36 | 59118.8 | 5712 | 9.63 | 35481.5 | 20893 | 50.90 | 24582.5 |
| 3 | 80% | 103953 | 105.28 | 59075.1 | 7684 | 12.80 | 35888.8 | 27871 | 68.07 | 24504.7 |
| 4 | 100% | 127640 | 129.41 | 59158.1 | 9468 | 16.07 | 35319.7 | 34086 | 80.84 | 25257.3 |
| 5 | 120% | 152373 | 154.13 | 59279.0 | 11336 | 19.19 | 35405.6 | 40589 | 96.81 | 25130.7 |
| 6 | 140% | 177636 | 179.46 | 59290.9 | 13263 | 22.30 | 35612.5 | 47167 | 112.78 | 25049.0 |
| 7 | 150% | 189707 | 192.02 | 59194.8 | 14203 | 24.07 | 35291.7 | 50228 | 119.77 | 25123.2 |
| SD | 105.75 | 208.79 | 288.66 | |||||||
| % RSD | 0.18% | 0.59% | 1.16% | |||||||
Table 11. Linearity of API's at various spiking levels.
| Name | %Y Intercept | Correlation coefficient | Response Factor (%RSD) |
|---|---|---|---|
| Paracetamol | -0.1 | 1.000 | 1.18% |
| Caffeine | 0.4 | 1.000 | 0.59% |
| Ibuprofen | -1.6 | 1.000 | 1.16% |
| Acceptance | -2 to +2 | NLT 0.99 | NMT 5% |
Table 12. Summary of linearity.
| Sample Name | Paracetamol | Caffeine | Ibuprofen | ||||||
|---|---|---|---|---|---|---|---|---|---|
| Peak Area | Amount mg/tab | %Label Claim | Peak Area | Amount mg/tab | %Label Claim | Peak Area | Amount mg/tab | %Label Claim | |
| 1 | 7406357 | 326.6 | 100.5 | 552989 | 39.9 | 99.8 | 2073280 | 199.8 | 99.9 |
| 2 | 7338309 | 323.4 | 99.5 | 552303 | 39.9 | 99.7 | 2077918 | 200.2 | 100.1 |
| 3 | 7360016 | 324.4 | 99.8 | 553631 | 40 | 99.9 | 2084750 | 200.8 | 100.4 |
| SD | 1.61 | 0.49 | 0.04 | 0.12 | 0.51 | 0.25 | |||
Table 13. Robustness (Low pH).
| Parameter | Acceptance | Paracetamol | Caffeine | Ibuprofen |
|---|---|---|---|---|
| % Label Claim | 95% to 105% | 99.9 | 99.8 | 100.1 |
| Similarity Factor | 0.98 to 1.02 | 0.99 | 0.98 | 1.01 |
Table 14. Summary of Robustness (low pH).
| Sample Name | Paracetamol | Caffeine | Ibuprofen | ||||||
|---|---|---|---|---|---|---|---|---|---|
| Peak Area | Amount mg/tab | %Label Claim | Peak Area | Amount mg/tab | %Label Claim | Peak Area | Amount mg/tab | %Label Claim | |
| 1 | 7364772 | 321.1 | 98.8 | 554575 | 40 | 100.0 | 2046088 | 200.8 | 100.4 |
| 2 | 7400597 | 322.8 | 99.3 | 555880 | 40.1 | 100.3 | 2055765 | 201.9 | 100.9 |
| 3 | 7369187 | 321.6 | 99.0 | 554293 | 40 | 100.1 | 2045168 | 201 | 100.5 |
| SD | 0.86 | 0.26 | 0.05 | 0.14 | 0.56 | 0.28 | |||
| RSD | 0.27 | 0.27 | 0.15 | 0.15 | 0.28 | 0.28 | |||
Table 15. Robustness (High pH).
| Parameter | Acceptance | Paracetamol | Caffeine | Ibuprofen |
|---|---|---|---|---|
| % Label Claim | 95% to 105% | 99.0 | 100.1 | 100.6 |
| Similarity Factor | 0.98 to 1.02 | 1.00 | 0.99 | 1.00 |
Table 16. Summary of robustness (high pH).
| Parameter | Acceptance | Paracetamol | Caffeine | Ibuprofen |
|---|---|---|---|---|
| % Label Claim | 95% to 105% | 99.4 | 99.0 | 99.0 |
| Similarity Factor | 0.98 to 1.02 | 0.98 | 0.98 | 1.00 |
Table 17. Summary of robustness (low flow rate).
| Sample Name | Paracetamol | Caffeine | Ibuprofen | |||||||
|---|---|---|---|---|---|---|---|---|---|---|
| Peak Area | Amount mg/tab | %Label Claim | Peak Area | Amount mg/tab | %Label Claim | Peak Area | Amount mg/tab | %Label Claim | ||
| 1 | 8197386 | 323.5 | 99.5 | 617630 | 39.7 | 99.3 | 2282308 | 198.6 | 99.3 | |
| 2 | 8172205 | 322.2 | 99.1 | 615123 | 39.5 | 98.8 | 2273102 | 197.6 | 98.8 | |
| 3 | 8184580 | 323 | 99.4 | 615999 | 39.6 | 99.0 | 2275068 | 197.9 | 99.0 | |
| SD | 0.66 | 0.20 | 0.10 | 0.25 | 0.50 | 0.25 | ||||
| RSD | 0.20 | 0.20 | 0.25 | 0.25 | 0.26 | 0.26 | ||||
Table 18. Robustness (Low flow rate).
| Sample Name | Paracetamol | Caffeine | Ibuprofen | |||||||
|---|---|---|---|---|---|---|---|---|---|---|
| Peak Area | Amount mg/tab | %Label Claim | Peak Area | Amount mg/tab | %Label Claim | Peak Area | Amount mg/tab | %Label Claim | ||
| 1 | 6668504 | 322.6 | 99.3 | 498142 | 39.6 | 99.0 | 1837498 | 198.6 | 99.3 | |
| 2 | 6673044 | 322.9 | 99.4 | 498715 | 39.7 | 99.2 | 1838632 | 198.8 | 99.4 | |
| 3 | 6639102 | 321.3 | 98.9 | 496605 | 39.5 | 98.7 | 1831277 | 198 | 99.0 | |
| SD | 0.84 | 0.26 | 0.08 | 0.20 | 0.40 | 0.20 | ||||
| RSD | 0.26 | 0.26 | 0.21 | 0.21 | 0.20 | 0.20 | ||||
Table 19. Robustness (High flow rate).
| Parameter | Acceptance | Paracetamol | Caffeine | Ibuprofen |
|---|---|---|---|---|
| % Label Claim | 95% to 105% | 99.2 | 99.0 | 99.2 |
| Similarity Factor | 0.98 to 1.02 | 0.98 | 0.98 | 0.98 |
Table 20. Summary of robustness (High flow rate).
Accuracy
Requirements
Standard solution (Recovery 50% level): Weigh accurately 162.5 mg of Paracetamol, 20 mg Caffeine, and 100 mg Ibuprofen into a 50 ml volumetric flask. Add sufficient amount of methanol, sonicate to dissolve, cool and dilute up to the mark with methanol. The above stock solution was further diluted 2 ml to 100 ml with methanol.
Standard solution (Recovery 100% level): Weigh accurately 325 mg of Paracetamol, 40 mg Caffeine, and 200 mg Ibuprofen into a 50 ml volumetric flask. Add sufficient amount of methanol, sonicate to dissolve, cool and dilute up to the mark with methanol. The above stock solution was further diluted 2 ml to 100 ml with methanol [8].
Standard solution (Recovery 150% level): Weigh accurately 487.5 mg of Paracetamol, 60 mg Caffeine, and 300 mg Ibuprofen into a 50 ml volumetric flask. Add sufficient amount of methanol, sonicate to dissolve, cool and dilute up to the mark with methanol. The above stock solution was further diluted 2 ml to 100 ml with methanol (Tables 21-25).
| Level | Paracetamol | Caffeine | Ibuprofen | ||||||
|---|---|---|---|---|---|---|---|---|---|
| Peak Area | Amount mg/tab | %Label Claim | Peak Area | Amount mg/tab | %Label Claim | Peak Area | Amount mg/tab | %Label Claim | |
| 50% | 3816748 | 101 | 0.22 | 288181 | 103 | 0.73 | 1050819 | 101 | 0.12 |
| 100% | 7573648 | 99 | 0.14 | 562381 | 100 | 0.31 | 2035228 | 101 | 0.08 |
| 150% | 11261934 | 99 | 0.03 | 839915 | 100 | 0.15 | 2991330 | 99 | 0.17 |
Table 21. Recovery table of Paracetamol, Caffeine and Ibuprofen.
| Parameter | Acceptance Criteria | Paracetamol | Caffeine | Ibuprofen |
|---|---|---|---|---|
| Recovery 50% | 98% to 102% | 101 | 103 | 101 |
| Recovery 100% | 98% to 102% | 99 | 100 | 101 |
| Recovery 150% | 98% to 102% | 99 | 100 | 99 |
| %RSD of Recovery | NMT 2 | 0.03 | 0.15 | 0.17 |
| Similarity Factor | 0.98 to 1.02 | 1.00 | 0.99 | 1.00 |
Table 22. Summary of accuracy.
| Sample Name | Paracetamol | Caffeine | Ibuprofen | ||||||
|---|---|---|---|---|---|---|---|---|---|
| Peak Area | Conc. | Response Factor | Peak Area | Conc. | Response Factor | Peak Area | Conc. | Response Factor | |
| 1 | 6960251 | 320.8 | 98.7 | 544569 | 39.7 | 99.2 | 544569 | 39.7 | 99.2 |
| 2 | 7113910 | 323.7 | 99.6 | 550444 | 39.6 | 99.0 | 550444 | 39.6 | 99.0 |
| 3 | 6944705 | 319.3 | 98.2 | 543543 | 39.5 | 98.8 | 543543 | 39.5 | 98.8 |
| 4 | 7138815 | 324.8 | 99.9 | 552295 | 39.7 | 99.3 | 552295 | 39.7 | 99.3 |
| 5 | 7117815 | 323.8 | 99.6 | 550579 | 39.6 | 99.0 | 550579 | 39.6 | 99.0 |
| 6 | 6931597 | 319 | 98.2 | 543636 | 39.6 | 98.9 | 543636 | 39.6 | 98.9 |
| SD | 2.51 | 0.77 | 0.07 | 0.19 | 0.07 | 0.19 | |||
| % RSD | 0.78 | 0.78 | 0.20 | 0.20 | 0.20 | 0.20 | |||
Table 23. Intermediate Precision Data for Paracetamol, Ibuprofen and caffeine.
| Parameter | Acceptance | Paracetamol | Caffeine | Ibuprofen |
|---|---|---|---|---|
| %RSD of Assay | NMT 2 | 0.78 | 0.20 | 0.18 |
| % Variation | NMT2 | 0.1 | 0.3 | 1.5 |
| Similarity Factor | 0.98 to 1.02 | 0.98 | 0.99 | 1.00 |
Table 24. Summary of intermediate precision (Ruggedness).
| Paracetamol | Caffeine | Ibuprofen | |||||||||||
|---|---|---|---|---|---|---|---|---|---|---|---|---|---|
| Area | mg/tab | % Label Claim |
% relative differ |
Area | mg/tab | % Label Claim |
% relative differ |
Area | Amount mg/tab | %Label Claim | % relative differ |
||
| 0 | 7411567 | 322.6 | 99.3 | 0.0 | 553845 | 39.4 | 98.6 | 0.0 | 2052065 | 201.2 | 100.6 | 0.0 | |
| 2 | 7436506 | 323.7 | 99.6 | 0.3 | 555885 | 39.6 | 99.0 | 0.4 | 2069954 | 202.9 | 101.5 | 0.9 | |
| 4 | 7434897 | 323.6 | 99.6 | 0.3 | 555679 | 39.6 | 98.9 | 0.3 | 2067476 | 202.7 | 101.3 | 0.8 | |
| 8 | 7445787 | 324.1 | 99.7 | 0.5 | 556076 | 39.6 | 99.0 | 0.4 | 2067943 | 202.7 | 101.4 | 0.8 | |
| 12 | 7446004 | 324.1 | 99.7 | 0.5 | 556104 | 39.6 | 99.0 | 0.4 | 2063880 | 202.3 | 101.2 | 0.6 | |
| 16 | 7419306 | 322.9 | 99.4 | 0.1 | 554280 | 39.5 | 98.7 | 0.1 | 2058591 | 201.8 | 100.9 | 0.3 | |
| 20 | 7386753 | 321.5 | 98.9 | 0.3 | 552865 | 39.4 | 98.4 | 0.2 | 2055739 | 201.5 | 100.8 | 0.2 | |
| 24 | 7461670 | 324.7 | 99.9 | 0.7 | 556740 | 39.7 | 99.1 | 0.5 | 2063585 | 202.3 | 101.1 | 0.6 | |
Table 25. Solution stability of Paracetamol Ibuprofen and Caffeine.
Orthogonal analysis
API's from other sources need to be characterized by conventional as well as orthogonal testing's as described in ICH Q6B [9]. Additional testing should include parameters or method to determine the suitability of the reference material not necessarily captured by the drug substance (e.g., more extensively in tracing related substance impurities).
Conclusion
The switch over of two different methods say Isocratic/gradient analysis for the same sample ensured greater resolution of analyte of interest in comparison with isocratic in gradient mode, and there is no relative substance impurities detected by variation in the method confirming the purity of the samples and the method is validated according to ICH 21 CFR guidelines and the method is robust in both isocratic and gradient mode.
References
- Ali NW, Hegazy MA, Abdelkawy M, et al. Simultaneous determination of methocarbamol and its related substance (guaifenesin) in 2 ternary mixtures with ibuprofen and diclofenac potassium by RP-HPLC method. J Liq Chromatogr Relat Technol. 2012;2229-42.
- Elkady EF, Fouad MA. Two liquid chromatographic methods for the simultaneous determination of ibuprofen and methocarbamol or chlorzoxazone in the presence of their degradation products. J Liq Chromatogr Relat Technol. 2012;882-95.
- Gul S, Sultana N, Arayne MS, et al. New method for optimization and simultaneous determination of sparfloxacin and non-steroidal anti-inflammatory drugs: Its in-vitro application. Am J Analyt Chem. 2012;328-37.
- Harde M, Wankhede S, Chaudhari P. Development of validated UV spectrophotometric method for simultaneous estimation of ibuprofen, paracetamol and caffeine in the bulk drug and marketed formulation. World J Pharm Res. 2015;1428-36.
- Haritha P, Sreenivasa Rao B, Sunandamma Y. Method development and validation for simultaneous determination of Paracetamol and Ketoprofen by RPHPLC Technique. Int J Appl Biol Pharm. 2014;110-22.
- Liu J. Determination of 4-isobutyl acetophenone in ibuprofen injections by HPLC. 2012;672-673.
- N Bassanese D. Protocolsfor finding themostorthogonal dimensions for two dimensional high performance liquid chromatography. Talanta. 2015;402-408.
- Rajavel P. Method develop. Asian J. 2013;8-17.
- Tuani YT, Nartey VK, Akanji O, et al. Simultaneous quantification of Paracetamol and Ibuprofen in fixed dose combination using RP-HPLC with UV detection. IJPCR. 2014;7-15.