Original Article
, Volume: 13( 1)Defluoridation of wastewater by natural bentonite clay in batch reactor...
- *Correspondence:
- Assaoui J , Faculty of Science, Biomaterials and Electrochemistry Team Laboratory, Chouaïb Doukkali University, El Jadida, Morocco, Tel: +212 0523342325; Fax: 212 0523342187; E-mail: assaoui.j@ucd.ac.ma
Received: January 25, 2018; Accepted: February 20, 2018; Published: February 23, 2018
Citation: Assaoui J, Kheribech A, Hatim Z. Defluoridation of Wastewater by Natural Bentonite Clay in Batch Reactor. Inorg Chem Ind J. 2018;13(1):121
Abstract
Adsorption potential of natural bentonite clay (NBC) was investigated for wastewater defluoridation using batch adsorption experiments. Mineralogical and physicochemical characterization of the adsorbent was carried out by X-Ray Diffraction (XRD), XRay Fluorescence (XRF), Energy Dispersive X-Ray attached to Scanning Electron Microscopy (SEM-EDX), BET Specific Surface Area (SSAN2BET) analysis and Fourier-Transform Infrared Spectrometry (FTIR). The effect of various operational parameters such as contact time, initial fluoride concentration, adsorbent dose and initial pH solution were evaluated in batch procedures at room temperature (25 ± 2°C). The results of the batch adsorption experiments proved that 30 min of contact time was sufficient for attaining equilibrium. The maximum wastewater defluoridation (52.2%) was obtained in the acidic conditions (pH=2) and for 5 mg L -1 and 2 g L-1 of initial fluoride concentration and adsorbent dose, respectively. Kinetic studies revealed that fluoride adsorption fitted well to pseudo-second-order. The adsorption isotherm of fluoride sorption on NBC indicated that the maximum adsorption capacity was noted to be 4.4 mg g-1 . Batch adsorption data was better described by Freundlich confirming multilayer adsorption with heterogeneous energetic distribution of active sites and with interaction between adsorbed molecules. The originality of this paper consisted in introducing the mechanisms that might occur in the fluoride adsorption process. SEM-EDX and FTIR characterization techniques were found to be useful for achieving this purpose. The obtained results indicated that the ion exchange was probably the main process involved in the fluoride adsorption, accompanied by interactions of fluoride with metal ions forming Metal–F complexes
Keywords
Defluoridation; Waste water; Natural bentonite clay; Batch study; Adsorption
Introduction
The presence of fluoride ion (F-) in water has been acknowledged as a major environmental problem worldwide [1] and has become a matter of great concern due to its chronic human carcinogenic behaviour [2]. The pollution of ground and surface waters by F- is mostly due to natural processes and anthropogenic activities. Naturally, the release of F- into groundwater resources occurs through the leaching of rocks containing hazardous pollutants supplemented with F- [3,4]. Anthropogenically, the industrial wastewaters contribute to the F- levels in aquatic systems [5,6]. Many industries (e.g. aluminium manufacturing industry, glass and ceramic production, semiconductor manufacturing, fertilizer, …) use compounds containing F- for leaching and cleaning process, giving rise to high F- concentrations in their wastewater, ranging from ten to thousands of mg L-1 comparing to natural waters [7], imposing a serious threat to human health [8-10]. Groundwater can be considered as one of the important sources of drinking water [11]. The discharge of industrial wastewater containing F- into the surface water would lead to groundwater pollution [12]. Thus, the consumption of this latter can be considered as the major path of human exposure [13,14]. High F- concentration in drinking water may cause dental or skeletal disorder [15,16], viz, osteoporosis, arthritis, and cancer [3,17]. The World Health Organization (WHO) classifies the F-, as one of the pollutants of water for human consumption. According to this specialized agency, the maximum acceptable F- concentration in drinking water must not exceed 1.5 mg L-1 [18-20]. Because of the high toxicity of F-, industrial wastewater containing such as a pollutant is strictly regulated worldwide. Different technologies for defluoridation of wastewater have been investigated to conquer the hazardous impacts of F- on the environment and human health. Defluoridation can be achieved by physicochemical and biological methods [21]. Most of physicochemical methods are based on electrocoagulation–flotation [22,23], membrane separation processes (reverse osmosis, nanofiltration, electrodialysis …) [24-26], fluidized-bed precipitation [27], ion exchange [26,28], electrochemical methods [26] and adsorption techniques [29-32]. Adsorption is considered as one of the most extensively used methods for wastewater defluoridation [33]. It has been proved to be a robust and an effective technology for industrial wastewater treatment [34-36]. Several adsorbents for F-removal have been described in literature, such as activated carbon derived from various biomass resources [37], natural Zeolites [38] and activated alumina [39], but research is warranted to discover alternative adsorbents, such as clay and clay minerals, abundantly present in nature, renewable and environmentally sustainable [40]. Smectites (montmorillonite) [41], serpentine minerals [42,43], kaolinite [44] and palygorskite-sepiolite [45] are some of the many classes of clays existing in nature which have been used for wastewater defluoridation. The negative charge on minerals structure is the origin of their adsorption capacity [46]. The adsorption properties of clay also come from their high surface area and porosity [47]. Some of these clays are characterized by a large specific surface area, chemical and mechanical stability, layered structure, high cation exchange capacity, which have made some of those mineral clays as an excellent adsorbent material [48]. Recently, there has been an increasing interest in exploiting clay minerals like bentonite [49,50], a naturally occurring clay mineral which consists mainly of montmorillonite and quartz. It is becoming a substitute for the use of expensive materials as adsorbent, because of its availability, relatively low-cost and high adsorption capacity [51]. The work reported here deals with an investigation into the use of locally available bentonite clay obtained from Northern part of Morocco. The NBC samples were tested in their natural state for wastewater defluoridation to improve naturally the F adsorption efficiency by optimizing the operational parameters such as contact time, initial F concentration, adsorbent dose and pH solution. The characterization of the substrate (NBC) after defluoridation has never been examined in our knowledge. For this purpose, physicochemical and mineralogical characterizations were carried out to explore the mechanisms which might probably be involved in the F- adsorption process.
Experimental
Materials
NBC samples were collected from Northern part of Morocco. All the chemicals used in the present study were of analytical reagent grade. Sodium fluoride (NaF), hydrochloric acid (HCl), caustic soda (NaOH) and TISAB III were purchased from Merck.
Physicochemical and mineralogical characterization
The NBC was characterized to determine in one hand, its mineralogical and physicochemical properties, and on the other hand to explore the mechanisms involved in the fluoride adsorption process. An accurate structural and compositional characterization of NBC was determined by X-Ray Diffraction (XRD X’Pert PRO PANALATYCAL) and X-Ray Fluorescence (XRF, OXFORDMDX 1000). The Specific Surface Area was determined by the BET method using nitrogen adsorption (SSAN2BET) (FLOWSORB II 2300, Micromeritics). Energy Dispersive X-ray attached to Scanning Electron Microscopy (SEM-EDX) was used to observe the morphological features of raw and used NBC (samples after defluoridation) and to determine the spot element analysis of these latter. In order to confirm the functional groups, present in raw and used NBC, Fourier Transform Infrared (FTIR Bruker VERTEX 70) with a resolution of 4 cm-1 where the band range varies from 400 to 4000 cm-1 were recorded on FTIR spectrometer.
Fluoride solutions preparation and analysis
Sodium fluoride (NaF) was used during adsorption experiments as the source of F-. A stock solution of 100 mg L-1 F- was prepared by dissolving 221 mg of NaF in 1000 mL of deionized water. Experimental solutions for various experiments were then prepared by appropriate dilution of the stock solution. F- concentration was measured by the potentiometric method [52] with a fluoride-specific ion electrode (WTW F800 Fluoride Combination Electrode) connected to a digital ion analyzer (WTW InoLab pH/Ion 7320). The use of Total Ionic Strength Adjustment Buffer III (TISAB III) was for maintaining the ionic strength pH constant to decomplex Metal–F complexes present in the sample during measurement [52]. All adsorption experiments were conducted at room temperature of 25°C ± 2°C.
Batch adsorption studies
The batch experiments consisted in analysing the effect of controlling parameters such as contact time, initial F- concentration, adsorbent dose and initial pH solution on F- adsorption onto NBC. All the experiments were conducted at room temperature of 25°C ± 2°C in 500 mL plexiglass reactor. A specific amount of NBC was added to fluoride-doped synthetic solution. The reaction mixture was continuously blended by an electric rod stirrer at 250 rpm. At equilibrium, the liquid phase is recovered in an Erlenmeyer flask after vacuum filtration through Whatman No. 42 filter paper for F- analysis, while the solid phase is recovered for physicochemical and mineralogical characterization.
Fluoride removal calculation
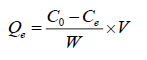
The specific amount of the adsorbed F-, Qe (mg g-1), was calculated according to eqn. (1):
 (1)
(1)
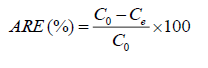
where, Qe is the adsorption capacity (mg g-1) in the solid at equilibrium; Co, Ce are initial and equilibrium concentrations of F- (mg L-1), respectively; V is the volume of the aqueous solution (L) and W is the mass (g) of adsorbent used in the experiments.
The adsorption removal efficiency (ARE), at equilibrium, was calculated by using eqn. (2):
 (2)
(2)
Modeling studies
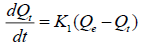
Kinetic models: The adsorption speed is largely influenced by several parameters, mainly the status of the solid matrix and the physicochemical conditions under which the adsorption takes place. The main objective of the study of adsorption kinetics is for understanding the involved mechanism and the rate controlling steps affecting the adsorption kinetics. Several models are exploited to fit the kinetic sorption tests. In this study, the kinetics of F- adsorption on NBC was verified using pseudo-first order and pseudo-second order, equation. The pseudo first order is a kinetic model described by the following Lagergren eqn. (3) [53]:
 (3)
(3)
The linear form of pseudo-first order kinetic model can be expressed by eqn. (4):
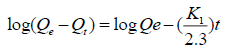 (4)
(4)
where, Qe and Qt are the amount of F- adsorbed (mg g-1) at equilibrium and at time ‘t’, respectively. K1 (min-1) represents the rate constant of pseudo-first order adsorption reaction. A straight line of log (Qe-Qt) against t suggests the applicability of these kinetic models. Both Qe and K1 can be determined from the intercept and slope of the curve, respectively. The linear form of pseudo-second order kinetic model can be expressed by eqn. (5) [54]:
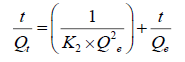 (5)
(5)
where, K2 is the rate constant for pseudo-second order reaction (g mg-1 min-1). Qeand Qt are the amounts of F- adsorbed at equilibrium and at any time ‘t’ (mg g-1), respectively. The straight-line plot of t/Qt against t for the kinetic data gives the values for Qe and K2 from the slope and intercept, respectively.
Adsorption isotherms: Adsorption equilibrium is established when the amount of adsorbate in the liquid phase (Ce) is in dynamic balance with that on the liquid-solid interface (Qe). Therefore, two isotherm equations have been used in the present study, namely Langmuir and Freundlich isotherm models to describe the equilibrium data. The Langmuir model is based on the hypothesis that uptake occurs on a homogenous surface by monolayer adsorption without interaction between adsorbed molecules. The Langmuir equation can be described in the following eqn. (6) [55]:
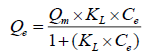 (6)
(6)
The linearized form of eqn. (6) can be written as eqn. (7):
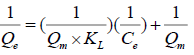 (7)
(7)
where, Ce is the equilibrium concentration of fluoride ions (mg L-1), Qe is a solid phase concentration of fluoride ions (mg g- 1), Qm (mg g-1), and KL (L mg-1) are empirical constants, can be evaluated from the slope and intercept of the linear plot of 1/Qe against 1/Ce.
The Freundlich model proposes a multilayer adsorption with a heterogeneous energetic distribution of active sites and with the interaction between adsorbed molecules. It is expressed mathematically in linear form as it is represented in eqn. (8) [56]:
 (8)
(8)
where, KF (mg g-1) and 1/n are Freundlich constants related to adsorption capacity and adsorption intensity, respectively. Those constants are obtained from the intercept and slope of log Qe versus log Ce linear plot respectively.
Results and Discussion
Characterization of adsorbent
X-Ray Diffraction (XRD) analysis: The structural characterization of NBC was carried out by X-Ray Diffraction (XRD) as shown in FIG. 1. XRD pattern of NBC showed that the material consisted mainly of Albite low [Na (AlSi3O8)], Sodium Zinc Orthosilicate [Na2Zn3(SiO4)2] and Montmorillonite [(Na, Ca)0.3 (Al, Mg)2 Si4O10(OH)2. xH2O]. The diffraction pattern was found to be typical for layered structure clays. Furthermore, the NBC was classified as Na-bentonite due to its mineralogical composition.

Figure 1: XRD patterns of NBC.
X-Ray Fluorescence (XRF) analysis: The chemical constituents of NBC are shown in TABLE 1. The analysis revealed that Silica (SiO2) was the main component at 45.06%, followed by alumina (Al2O3) at 22.46%, confirming that NBC is an alumino-silicate material. The relatively high concentrations of MgO, Na2O and CaO may probably result in the formation of Metal–F complex after F adsorption. This hypothesis will be confirmed in the following characterizations of the raw adsorbent.
| Element as oxides | % wt |
|---|---|
| SiO2 | 45.06 |
| Al2O3 | 22.46 |
| Fe2O3 | 4.91 |
| Na2O | 2 |
| MgO | 2.78 |
| SO3 | 0.25 |
| K2O | 0.46 |
| CaO | 1.61 |
| PF=%CO2 | 20.47 |
Table 1: Elemental composition of raw NBC.
BET Specific Surface Area (SSAN2BET) analysis: An important physical property of clay minerals is their high surface areas. It plays a pivotal role in the adsorption of chemical substances from the solution, the higher the surface area, the higher the adsorption of chemical substances. Total surface area depends on both internal and external surface areas. TABLE 2 shows the BET-N2 determined surface areas (micropore area and external surface area) and micropore volumes of the adsorbent. According to the results, NBC presents a relatively high surface area ( ˜ 59.93 m2 g-1) comparing to the most of Na-dominated bentonites which have a specific surface area values<40 m2 g-1 with some exceptions [57]. The value of SSAN2BET indicated that our material is characterized by an important physical property in terms of the F-adsorption capacity compared to natural bentonites usually reported in the literature for wastewater defluoridation [57]. Furthermore, the BET-N2 results of the present study confirm that Na-bentonites tend to have low specific surface area values than Ca/Mg-bentonites [57]. However, the SSAN2BET is known to depend on the type of interlayer cation.
| Sample | BET surface area (m2 g-1) | External surface area (m2 g-1) | Micropore area (m2 g-1) | Micropore volume (cm3 g-1) |
|---|---|---|---|---|
| NBC | 59.9276 | 43.2182 | 16.7095 | 0.008366 |
Table 2: Surface areas and micropore volumes of the NBC.
Energy Dispersive X-ray attached to Scanning Electron Microscopy (SEM-EDX): The results of SEM-EDX analysis Of raw (a) and used (b) NBC are presented in FIG. 2. The SEM pictures of both raw and used NBC showed no distinct change in the surface morphology and appeared to have the layered structure. The spectra of raw NBC (FIG. 2A) indicated the presence of many cations and three anions which are sulphur, phosphorous and oxygen. After defluoridation (FIG. 2B) the peak of F- appeared, while, there was a total disappearance of sulphur peaks, an important decrease of the phosphorus peak and a slight decrease of some cations peaks (Al, Mg, Fe, …). of F- onto NBC, where the process of ion exchange can take place between anions present on the adsorbent surface and F- in the aqueous solution, and also ions and F-. The intense peak of oxygen reflects the hydroxylated surface of NBC (OH groups). Its decrease after defluoridation confirms the ion exchange process between F- and OH-.

Figure 2: SEM-EDX of raw (A) and used (B) NBC.
Fourier-Transform Infrared Spectrometry (FTIR) analysis: FTIR analysis was carried out to determine the functional groups of NBC and to understand the adsorption mechanism. FIG. 3 shows the FTIR spectra of raw and used NBC samples recorded in the region of 400 cm-1–4000 cm-1. The analysis results show three main absorption regions: 3000 cm-1–3800 cm-1,1500 cm-1–1800 cm-1 and 400 cm-1 –1200 cm-1. Those absorbance regions were found in concordance with those obtained by Yang et al. [58] in Na-bentonite suspensions. A notable difference was observed in those regions in raw and used NBC. The spectral band at 3618.10 cm-1 reflects the O–H stretching vibration of the silanol (Si– OH) groups from the soli d and the broad band at 3440.70 cm-1 may be attributed to H–OH vibration of the water molecules adsorbed on the solid surface. The spectral band at 1643.12 cm-1 reflects the bending of H–OH bond of water molecules. The peak at 1118.60 cm-1 is corresponded to Si–O vibration. The IR peaks at 918.01 and 524.60 cm-1 may be attributed to stretching and vibration of Al– OH–Al and Al–O–Si bending vibrations, respectively. After defluoridation process, it has been observed variations in the intensity of transmittance in all the peaks (consisting most of them of OH groups), which indicates F- adsorption onto NBC. Since OH and F- ions have very similar dimensions, they can replace each other (ion exchange) in such way that Metal–F complexes can be formed by the interaction of fluoride and hydroxide ions with metal ions.

Figure 3: FTIR spectra of raw and used NBC samples.
Batch experiments results
Effect of contact time: The effect of contact time on the percentage of F- adsorbed (%) was investigated to ensure equilibrium state between aqueous F- and the adsorbent. FIG. 4 shows the progression of adsorption reaction, the percentage of the F- adsorbed onto the adsorbent after different contact times. It was observed that with a fixed amount of the adsorbent, the percentage of F adsorbed (%) increased with contact time and began to reach equilibrium after 30 min of reaction. Consequently, the period of contact time fixed for further adsorption experiments was 30 min.

Figure 4: Effect of contact time on the percentage of F- adsorbed (%).
Effect of initial fluoride concentration: The effect of initial concentration on the percentage of F- removal was carried out to determine the maximum adsorption capacity of NBC. Six initial F- concentrations were chosen: 5, 10, 20, 40, 80 and 100 mg L-1. The adsorbent dose and initial Ph solution were fixed at 2 g L-1 and 5.6 ± 0.2 (natural pH) respectively. As shown in FIG. 5, the adsorption capacity reached stability at a high initial concentration (4.40 mg g-1). This can be explained by saturation of the available active adsorption sites. Although, the percentage of F- removal decreased with an increase in the initial concentration. This decrease is due to the presence of more F- ion in solution at higher initial F- concentration. However, the efficient F- removal at a low initial concentration was because of important ratio of surface active sites to total F- ions present in solution.

Figure 5: F- removal and adsorption capacity against initial F- concentration (natural pH=5.6 ± 0.2, contact time=30 min, adsorbent dose=2 g L-1, agitation speed=250 rpm, T=25°C ± 2 °C).
Effect of adsorbent dose: The effect of adsorbent dose on the percentage of F- removal (%) was determined for 5 mg L-1 initial F- concentration at natural pH 5.6 ± 0.2. The tested adsorbent doses varied from 2 g L-1 to 12 g L-1 as shown in FIG. 6. It was observed that the percentage of F- removal increased slightly with increasing adsorbent dose up to 8 g L-1. The increase of percent F- removal with the increase of adsorbent dose is due to the availability of sufficient adsorption sites. However, the addition of the adsorbent dose didn’t show any considerable increase in the percentage of F- removal. This may be probably due to the overlapping phenomenon of the active sites at a higher adsorbent dose resulting in a reduction of surface area.

Figure 6: Effect of adsorbent dose on percentage of F- removal (natural pH=5.6 ± 0.2, initial F- concentration=5 mg L-1, contact time=30 min, agitation speed=250 rpm, T=25°C ± 2°C).
Effect of initial pH solution: The effect of initial pH solution on the F- removal was carried out in the pH range of 2–12. The initial F- concentration and the adsorbent dose were fixed at 5 mg L-1 and 2 g L-1 respectively. The pH adjustment was realized by using 0.1 N (HCl) or 0.1 N (NaOH). FIG. 7 illustrates the evolution of the percentage of F- removal over the pH range of 2–12. It was observed that as the pH of the initial F- solution increased from 2 to 12, the percentage of F- removal by NBC decreased from 52.2% to 20%. This can be explained by the pH dependency of the NBC toward F- adsorption in the acid conditions, which is in concordance with the results obtained by Srimurali and Bar-Yosef [49,59]. In the other hand, there were no considerable evolutions in the percentage of F- removal within a pH range of 4–6. Regarding the mechanism involved during wastewater defluoridation, it is well known that NBC consists of a mixture of several oxides. The hydroxilated surfaces of these latters develop charge on the surface in a humid environment. Low pH values probably result in the neutralization of the negative charges developed at the surface of NBC, which may consequently result in the increased adsorption of the negatively charged fluoride ion.

Figure 7: Effect of pH on percentage of F- removal (adsorbent dose=2 g L-1, initial F- concentration=5 mg L-1, contact time=30 min, agitation speed=250 rpm, T=25°C ± 2°C).
Kinetic studies
The two models (pseudo-first order and pseudo-second order) were used to investigate the kinetics of the F- adsorption onto NBC, in order to understand the mechanism and the rate controlling steps affecting the adsorption kinetics. As shown in FIG. 8, the pseudo-first order

Figure 8: Adsorption kinetics for F- onto NBC.
(a) has a very low correlation coefficient (R2 ˜ 0.500). Contrariwise, the pseudo-second order
(b) was found to give the best fit (R2=0.999) and therefore, it could be used to predict the adsorption kinetics of F- onto NBC.
Adsorption isotherm
The adsorption capacity Qe (mg g-1) of NBC was examined by determining equilibrium sorption of F- as a function of residual F- concentration present in the liquid phase. The variation of the adsorption capacity of NBC for F- is presented in FIG. 9.

Figure 9: Adsorption isotherm of F- sorption on NBC (adsorbent dose=2 g L-1, natural pH=5.6 ± 0.2, contact time=30 min, initial concentration 5 mg L-1?100 mg L-1, agitation speed=250 rpm, T=25°C ± 2°C).
According to the equilibrium curve, the adsorption capacity at equilibrium increases progressively at lower F- concentration. This is because of the availability of excess adsorption sites. On the other hand, as the F- concentration increases, the adsorption capacity at equilibrium progressively decreases until reaching saturation. The availability of adsorption sites at high F- concentration becomes the limiting factor as the adsorbent surface reaches maximum adsorption capacity. This latter was observed to be 4.40 mg g-1.
The equilibrium data was further processed using Langmuir and Freundlich isotherms. The Langmuir and Freundlich adsorption isotherms for the F- adsorption onto NBC are presented in FIG. 10. According to experimental data, it can be observed that Freundlich isotherm (FIG. 10 (b)) (R2=0.993) better describes the adsorption data than the Langmuir isotherm (FIG. 10(a)) (R2=0.940). The value of 1/n is 0.39 for Freundlich isotherm. Since the value of this constant, 1/n (adsorption intensity) is between 0 and 1 (0<1/n<1), it indicates a favorable adsorption. Basing on Freundlich concept, the F- adsorption system was more likely a multilayer coverage of the NBC with heterogeneous energetic dispersion of active sites and with interaction between adsorbed molecules.
Figure 10: Langmuir (a) and Freundlich (b) isotherm plots for F- adsorption onto NBC (adsorbent dose=2 g L-1, natural pH=5.6 ± 0.2, contact time=30 min, initial F- concentration 5 mg L-1?100 mg L-1, agitation speed=250 rpm, T=25°C ±2°C).
Conclusion
The defluoridation efficiency of NBC was evaluated in a batch adsorption reactor at room temperature (25°C ± 2°C). The results of the batch adsorption experiments demonstrated that 30 min of contact time between the adsorbent and the wastewater was sufficient to achieve equilibrium. It was observed that the maximum wastewater defluoridation (52.2%) was obtained in the acidic conditions (pH=2) and for 5 mg L-1 and 2 g L-1 of initial F- concentration and adsorbent dose, respectively. Kinetic studies revealed that F- adsorption fitted well to pseudo-second-order model. Furthermore, the adsorption isotherm of F- sorption on NBC indicated that the maximum adsorption capacity of this latter was noted to be 4.4 mg g-1. The experimental data indicated that the Freundlich isotherm was the suitable model for describing the F- adsorption onto NBC because of its high correlation coefficient. According to Freundlich concept, the adsorption of F- onto NBC was multilayer with heterogeneous distribution of active sites and with interaction between adsorbed molecules. The originality of this paper consisted in introducing the mechanisms that might occur in the F- adsorption process by physicochemical characterization of raw and used NBC. The obtained results indicated that the ion exchange was probably the main process involved in the F- adsorption process, accompanied by interactions of fluoride with metal ions. Therefore, the use of NBC as an adsorbent for wastewater defluoridation is potentially cost-effective. However, the NBC can be modified by introducing chemicals that aims at developing a low-cost novel adsorbent, presenting a compatible physicochemical property with fluorine chemistry.
Nomenclature
C0: Initial F- concentrations (mg L-1)
Ce: Equilibrium concentrations of F- (mg L-1)
Kad: Rate constant (min-1)
KF: Freundlich constants related to adsorption capacity (mg g-1)
K1: Pseudo-first order rate constant (min-1)
K2: Pseudo-second order rate constant (g mg-1 min-1)
N: Adsorption intensity (heterogeneity factor)
Q: Amount of F- adsorbed per unit mass of adsorbent at time t
Qe: Equilibrium adsorbate capacity (mg g-1)
V: Volume of the aqueous solution (mL)
W: Mass of adsorbent (g).
References
- Chen N, Zhang Z, Feng C, et al. Investigations on the batch and fixed-bed column performance of fluoride adsorption by Kanuma mud. Desalination. 2011;268(1-3):76-82.
- Vinati A, Mohanty B, Behera SK. Clay and clay minerals for fluoride removal from water: A state-of-the-art review. App Clay Sci. 2015;114:340-8.
- Bhatnagar A, Kumar E, Sillanpää M. Fluoride removal from water by adsorption: A review. Chem Eng J. 2011;171(3):811-40.
- Daifullah AA, Yakout SM, Elreefy SA. Adsorption of fluoride in aqueous solutions using KMnO4-modified activated carbon derived from steam pyrolysis of rice straw. J Hazard Mater. 2007;147(1-2):633-43.
- Thakre D, Rayalu S, Kawade R, et al. Magnesium incorporated bentonite clay for defluoridation of drinking water. J Hazard Mater. 2010;180(1-3):122-30.
- Waghmare S, Lataye DH, Arfin T, et al. Defluoridation by nano-materials, building materials and other miscellaneous materials: A systematic review. Int J Innov Res Sci Eng Technol. 2015; 4:11998-12010.
- De la Puente G, Pis JJ, Menéndez JA, et al. Thermal stability of oxygenated functions in activated carbons. J Anal Appl Pyrolysis. 1997;43(2):125-38.
- Chaturvedi AK, Yadava KP, Pathak KC, et al. Defluoridation of water by adsorption on fly ash. Water Air Soil Pollut. 1990;49(1-2):51-61.
- Sujana MG, Thakur RS, Rao SB. Removal of fluoride from aqueous solution by using alum sludge. J Colloid Interface Sci. 1998;206(1):94-101.
- Toyoda A, Taira T. A new method for treating fluorine wastewater to reduce sludge and running costs. IEEE Trans Semicond Manuf. 2000;13(3):305-9.
- Joshi S, Pradhananga MA. Removal of fluoride ions by adsorption onto Fe2O3/areca nut activated carbon composite. J Inst Eng. 2017;12(1):175-83.
- Shen F, Chen X, Gao P, et al. Electrochemical removal of fluoride ions from industrial wastewater. Chem Eng Sci. 2003;58(3-6):987-93.
- Agarwal M, Rai K, Shrivastav R, et al. Deflouridation of water using amended clay. J Clean Prod. 2003;11(4):439-44.
- Sujana MG, Pradhan HK, Anand S. Studies on sorption of some geomaterials for fluoride removal from aqueous solutions. J Hazard Mater. 2009;161(1):120-5.
- Sorg TJ. Treatment technology to meet the interim primary drinking water regulations for inorganics. J Am Water Works Ass. 1978;70:105-111.
- Gao S, Sun R, Wei Z, et al. Size-dependent defluoridation properties of synthetic hydroxyapatite. J Fluorine Chem. 2009;130(6):550-6.
- Wambu EW, Onindo CO, Ambusso W, et al. Removal of fluoride from aqueous solutions by adsorption using a siliceous mineral of a Kenyan origin. Clean Soil Air Water. 2013;41(4):340-8.
- Guidelines for Drinking Water Quality. World Health Organization, Geneva. 1993;45:21.
- Rao CRN, Karthikeyan J. Removal of fluoride from water by adsorption onto lanthanum oxide. Water Air Soil Pollut. 2011;223:1101-14.
- Singh K, Lataye DH, Wasewar KL, et al. Removal of fluoride from aqueous solution: Status and techniques. Desalin Water Treat. 2013;51(16-18):3233-47.
- Mekonen A, Kumar P, Kumar A. Integrated biological and physiochemical treatment process for nitrate and fluoride removal. Water Res. 2001;35(13):3127-36.
- Huang CJ, Liu JC. Precipitate flotation of fluoride-containing wastewater from a semiconductor manufacturer. Water Res. 1999;33(16):3403-12.
- Hu CY, Lo SL, Kuan WH, et al. Removal of fluoride from semiconductor wastewater by electrocoagulation-flotation. Water Res. 2005;39(5):895-901.
- Karabelas AJ, Yiantsios SG, Metaxiotou Z, et al. Water and materials recovery from fertilizer industry acidic effluents by membrane processes. Desalination. 2001;138(1-3):93-102.
- Ndiaye PI, Moulin P, Dominguez L, et al. Removal of fluoride from electronic industrial effluent by RO membrane separation. Desalination. 2005;173(1):25-32.
- Miretzky P, Cirelli AF. Fluoride removal from water by chitosan derivatives and composites: A review. J Fluorine Chem. 2011;132(4):231-40.
- Aldaco R, Irabien A, Luis P. Fluidized bed reactor for fluoride removal. Chem Eng J. 2005;107(1-3):113-7.
- Ruixia L, Jinlong G, Hongxiao T. Adsorption of fluoride, phosphate, and arsenate ions on a new type of ion exchange fiber. J Colloid Interface Sci. 2002;248(2):268-74.
- YangM M, Hashimoto T, Hoshi N, et al. Fluoride removal in a fixed bed packed with granular calcite. Water Research. 1999;33(16):3395-402.
- Haron MJ, Wan Yunus WM. Removal of fluoride ion from aqueous solution by a cerium-poly (hydroxamic acid) resin complex. J Environ Sci Heal A. 2001;36(5):727-34.
- Lokshin EP, Belikov ML. Water purification with titanium compounds to remove fluoride ions. Russ J App Chem. 2003;76(9):1466-71.
- Zhou Y, Yu C, Shan Y. Adsorption of fluoride from aqueous solution on La3+-impregnated cross-linked gelatin. Sep Purif Technol. 2004;36(2):89-94.
- Mahramanlioglu M, Kizilcikli I, Bicer IO. Adsorption of fluoride from aqueous solution by acid treated spent bleaching earth. J Fluorine Chem. 2002;115(1):41-7.
- Tripathy SS, Bersillon JL, Gopal K. Removal of fluoride from drinking water by adsorption onto alum-impregnated activated alumina. Sep Purif Technol. 2006;50(3):310-7.
- Mandal S, Mayadevi S. Defluoridation of water using as-synthesized Zn/Al/Cl anionic clay adsorbent: Equilibrium and regeneration studies. J Hazard Mater. 2009;167(1-3):873-8.
- Liu H, Deng S, Li Z, et al. Preparation of Al-Ce hybrid adsorbent and its application for defluoridation of drinking water. J Hazard Mater. 2010;179(1-3):424-30.
- Karthikeyan J, siva IS. Fluoride sorption using Morringa indica-based activated carbon. Iranian J Environ Health Sci Eng. 2007;4:21-8.
- Sun Y, Fang Q, Dong J, et al. Removal of fluoride from drinking water by natural stilbite zeolite modified with Fe (III). Desalination. 2011;277(1-3):121-7.
- Ghorai S, Pant KK. Equilibrium, kinetics and breakthrough studies for adsorption of fluoride on activated alumina. Sep Purif Technol. 2005;42(3):265-71.
- R. Srinivasan. Advances in application of natural clay and its composites in removal of biological, organic, and inorganic contaminants from drinking water. Adv Mater Sci Eng. 2011(2011)1-17.
- Bia G, De Pauli CP, Borgnino L. The role of Fe (III) modified montmorillonite on fluoride mobility: Adsorption experiments and competition with phosphate. J Environ Manage. 2012;100:1-9.
- Kulkarni DN, Nawlakhe GW. Serpentine-Its limitations as a defluoridation medium. Indian J Environ Health. 1974;16:151.
- Chidambaram S, Ramanathan AL, Vasudevan S. Fluoride removal studies in water using natural materials. Water SA. 2003;29(3):339-44.
- Wei S, Xiang W. Surface properties and adsorption characteristics for fluoride of kaolinite, ferrihydrite and kaolinite-ferrihydrite association. J Food Agric Environ. 2012;10:923-9.
- Zhang S, Lü Y, Lin X, et al. Performance and mechanisms of fluoride removal from groundwater by lanthanum-aluminum-loaded hydrothermal palygorskite composite. Chem Res Chin Univ. 2015;31(1):144-8.
- Crini G. Non-conventional low-cost adsorbents for dye removal: A review. Bioresour Technol. 2006;97(9):1061-85.
- Alkan M, Demirba? Ö, Celikcapa S, et al. Sorption of acid red 57 from aqueous solution onto sepiolite. J Hazard Mater. 2004;116(1-2):135-45.
- Gitari WM, Ngulube T, Masindi V, et al. Defluoridation of groundwater using Fe3+-modified bentonite clay: Optimization of adsorption conditions. Desalin Water Treat. 2015;53(6):1578-90.
- Srimurali M, Pragathi A, Karthikeyan J. A study on removal of fluorides from drinking water by adsorption onto low-cost materials. Environ Pollut. 1998;99(2):285-9.
- Ma Y, Shi F, Zheng X, et al. Removal of fluoride from aqueous solution using granular acid-treated bentonite (GHB): Batch and column studies. J Hazard Mater. 2011;185(2-3):1073-80.
- Uddin MK. A review on the adsorption of heavy metals by clay minerals, with special focus on the past decade. Chem Eng J. 2017;308:438-62.
- NF T 90-004: Water quality ? Determination of fluoride ion ? Potentiometric method. 2002.
- Bhattacharyya KG, Gupta SS. Influence of acid activation on adsorption of Ni (II) and Cu (II) on kaolinite and montmorillonite: Kinetic and thermodynamic study. Chem Eng J. 2008;136(1):1-13.
- Unuabonah EI, Adebowale KO, Olu-Owolabi BI. Kinetic and thermodynamic studies of the adsorption of lead (II) ions onto phosphate-modified kaolinite clay. J Hazard Mater. 2007;144(1-2):386-95.
- Langmuir I. The constitution and fundamental properties of solids and liquids. Part I. Solids. J Am Chem Soc. 1916;38(11):2221-95.
- Freundlich HM. Over the adsorption in solution. J Phys Chem. 1906;57:385-470.
- Kaufhold S, Dohrmann R, Klinkenberg M, et al. N2-BET specific surface area of bentonites. J Colloid Interface Sci. 2010;349(1):275-82.
- Yang S, Zhao D, Zhang H, et al. Impact of environmental conditions on the sorption behavior of Pb (II) in Na-bentonite suspensions. J Hazard Mater. 2010;183(1-3):632-40.
- Bar-Yosef B, Afik I, Rosenberg R. Fluoride sorption by montmorillonite and kaolinite1. Soil Sci. 1988;145(3):194-200.